
Stop writing monolithic batch scripts that break silently at 3 AM. Here is how to design, architect, 2026-10-6 20:14:31 Author: hackernoon.com(查看原文) 阅读量:2 收藏
Stop writing monolithic batch scripts that break silently at 3 AM. Here is how to design, architect, and code a resilient, observable streaming data pipeline using Python, Apache Kafka, and Apache Airflow.
1. Introduction: The 3 AM Pipeline Nightmare
We’ve all been there. Your phone buzzes at 3:14 AM. A Slack alert flashes red: Pipeline Failed: Out of Memory. You log into the server, only to find that an upstream schema change quietly broke the ingestion parser, cascading errors across downstream analytics tables.
Legacy batch pipelines built on rigid architectures struggle to keep pace with modern data velocity. To build trust with stakeholders, data engineers need to shift toward resilient, modular, and observable pipelines.
 Every data engineer’s favorite midnight wake-up call
 Every data engineer’s favorite midnight wake-up call
2. The Blueprint: High-Level Architecture Design
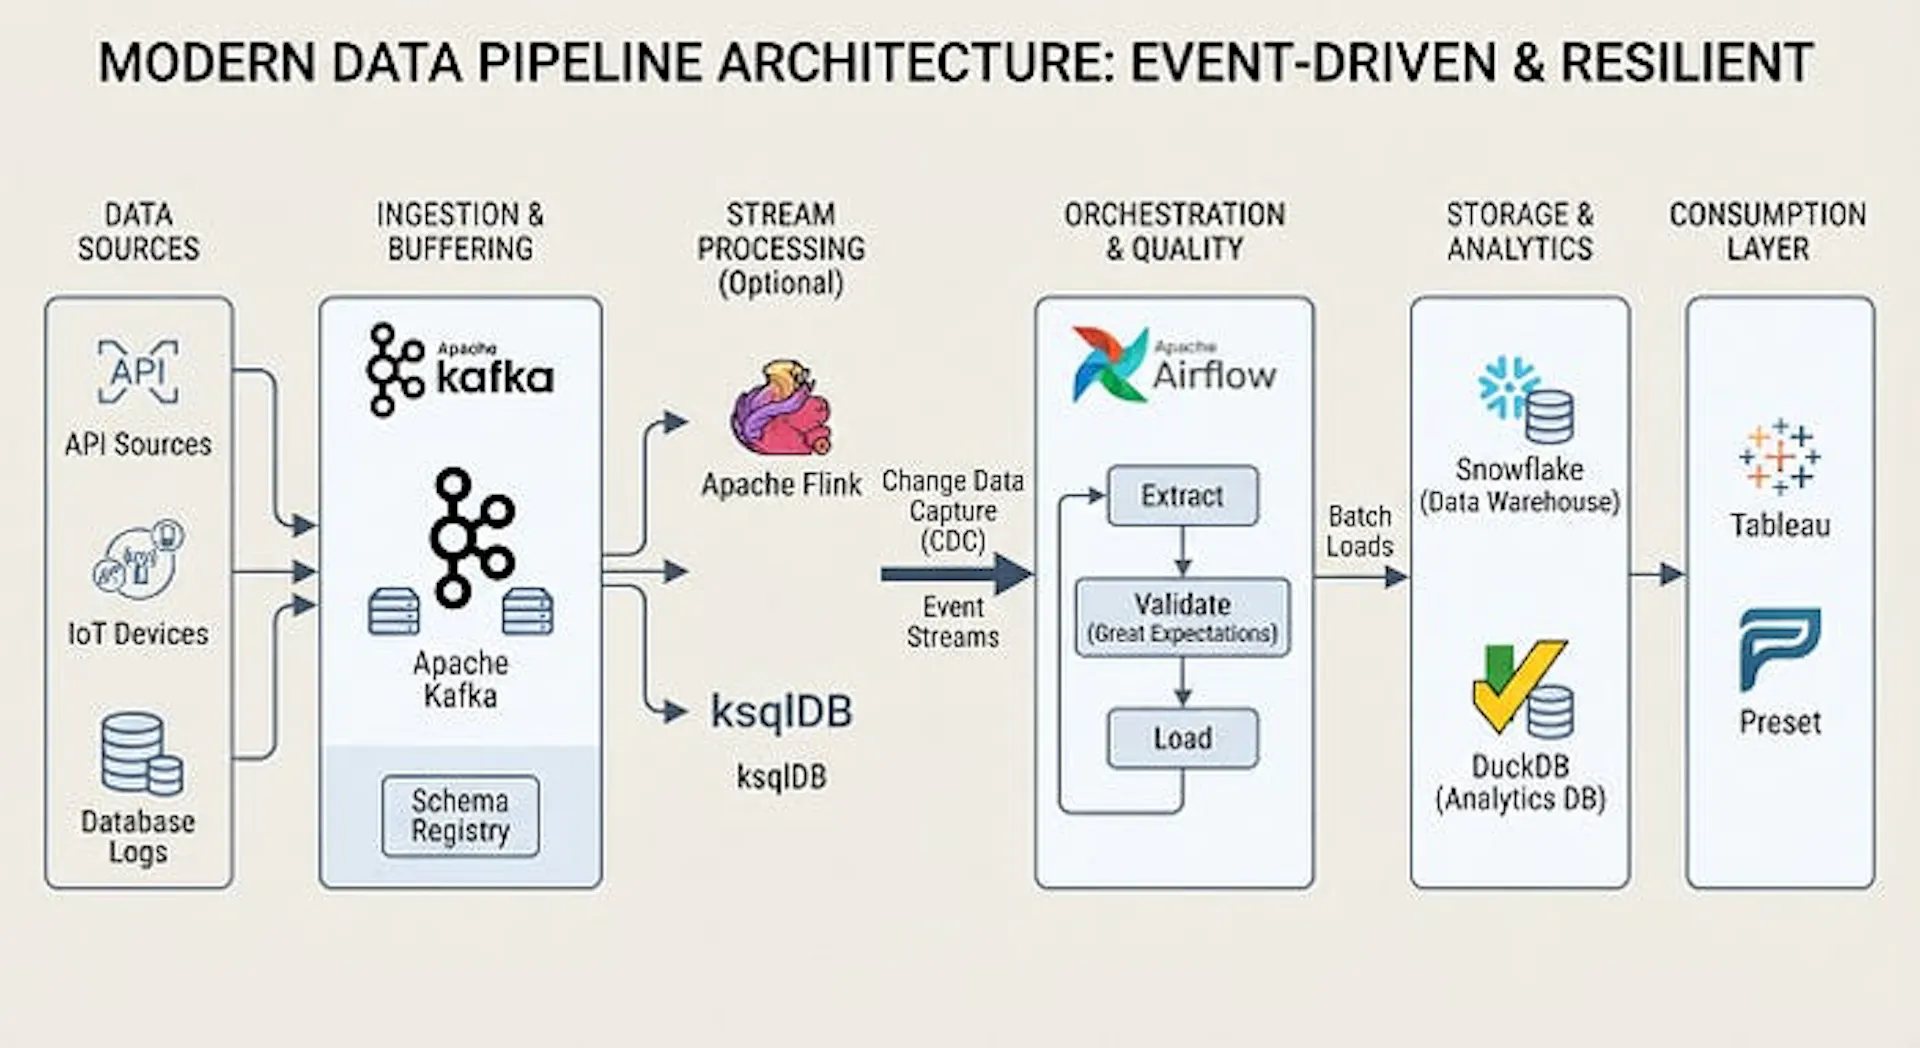
Before writing a single line of code, establishing a clear architectural contract is essential. A modern data pipeline decouples ingestion, processing, and orchestration so that a failure in one layer doesn’t crash the entire system.
[ Data Sources ]
       │ (JSON / API)
       ▼
[ Apache Kafka ] ──(Streaming Ingestion)
       │
       ▼
[ Apache Airflow ] ──(Orchestration & Validation)
       │
       ▼
[ DuckDB / Snowflake ] ──(Analytics Ready)
Key Components of This Stack:
- Ingestion Layer (Kafka): Acts as our reliable buffer, absorbing traffic spikes without dropping payloads.
- Orchestration Layer (Airflow): Manages dependencies, scheduled batch syncs, and data quality checks.
- Storage Layer (Snowflake / DuckDB): Optimized columnar storage for lightning-fast analytical queries
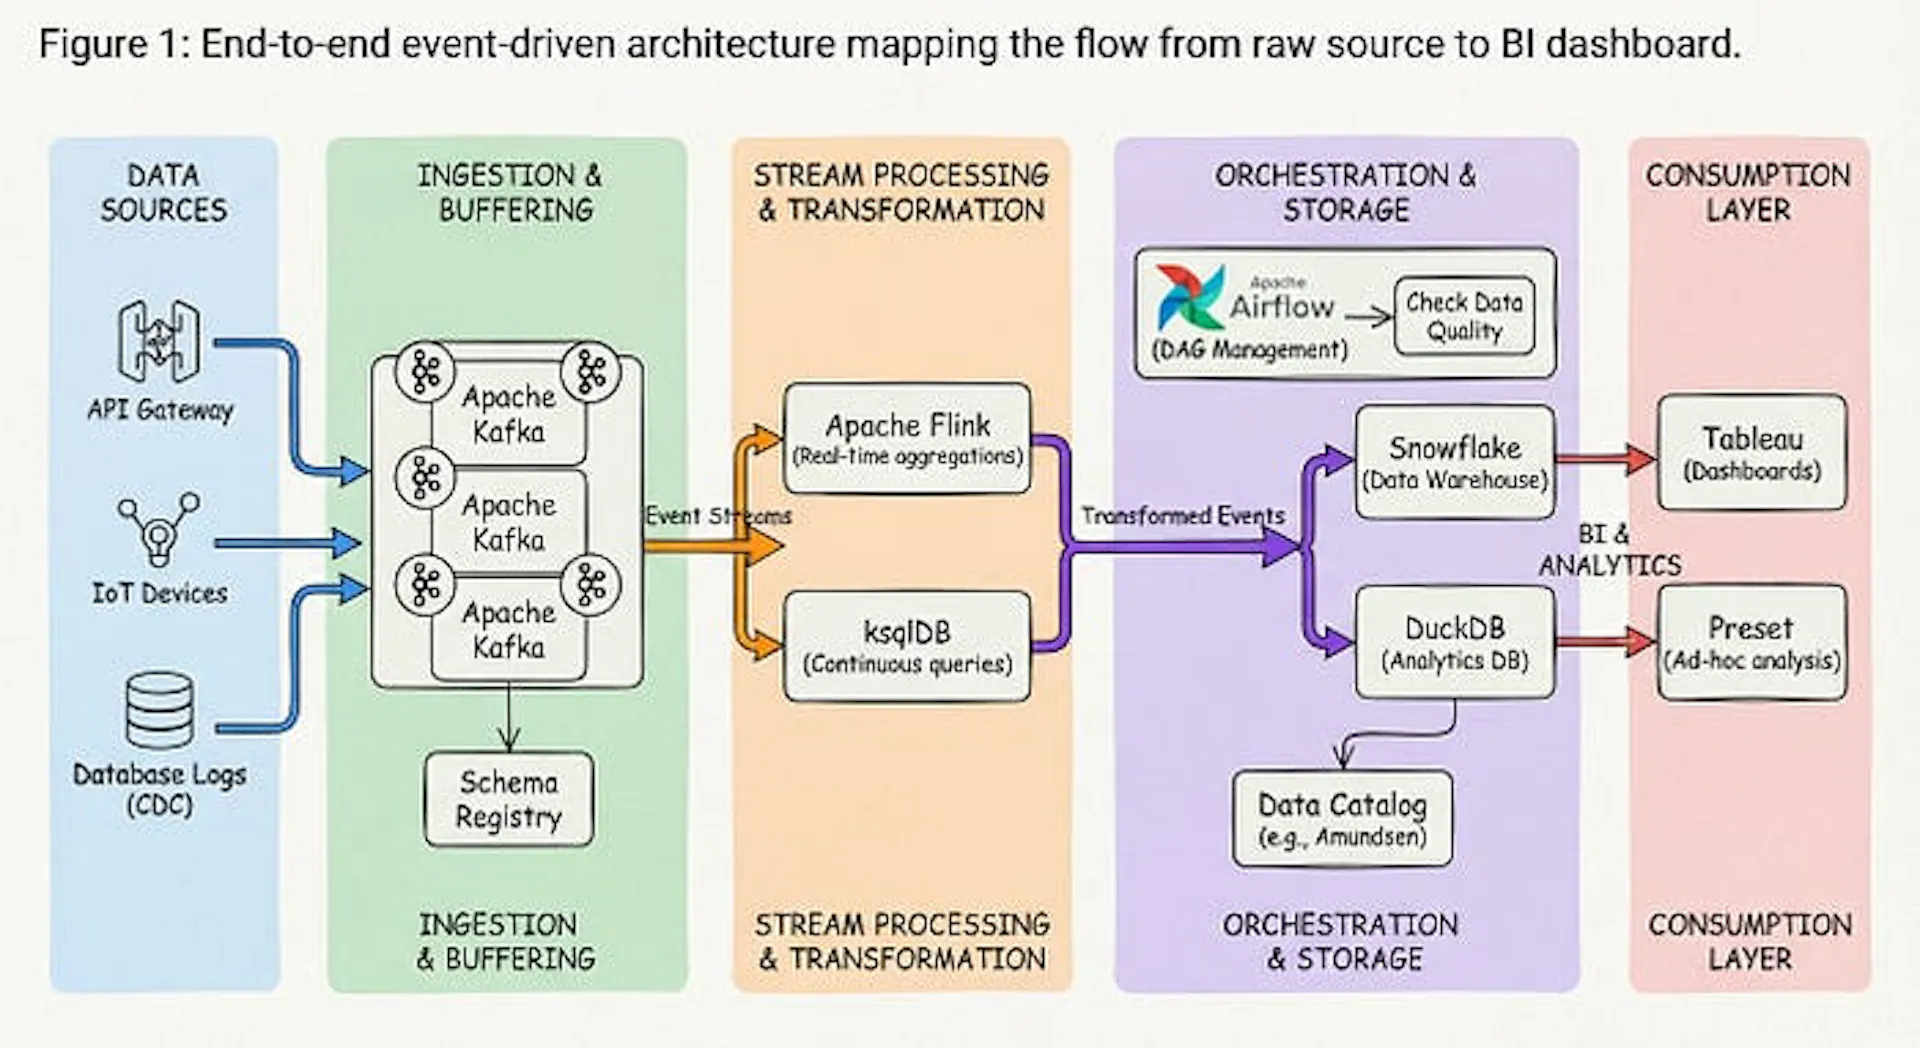 End-to-end event-driven architecture mapping the flow from raw source to BI dashboard.
3. Step-by-Step Implementation
Let’s look at how to tie the ingestion and orchestration together. Below is a minimal implementation of a Python producer pushing events to Kafka, paired with an Airflow DAG snippet that triggers downstream validation.
Step A: Streaming Ingestion (Python + Kafka)
Python
from kafka import KafkaProducer
import json
import time
producer = KafkaProducer(
    bootstrap_servers=['localhost:9092'],
    value_serializer=lambda v: json.dumps(v).encode('utf-8')
)def stream_sensor_data():
    for i in range(100):
        payload = {"sensor_id": f"sens_{i}", "temperature": 22.5 + (i % 5), "timestamp": time.time()}
        producer.send('sensor_readings', value=payload)
        time.sleep(0.5)
    producer.flush()if __name__ == "__main__":
    stream_sensor_data()
Step B: Orchestration (Airflow DAG)
Python
from airflow import DAG
from airflow.operators.python import PythonOperator
from datetime import datetime
def validate_data_quality():
    print("Running schema and null-check assertions...")default_args = {'owner': 'data_eng', 'start_date': datetime(2026, 1, 1)}with DAG('pipeline_orchestration', default_args=default_args, schedule_interval='@hourly') as dag:
    task_validate = PythonOperator(
        task_id='validate_data',
        python_callable=validate_data_quality
    )
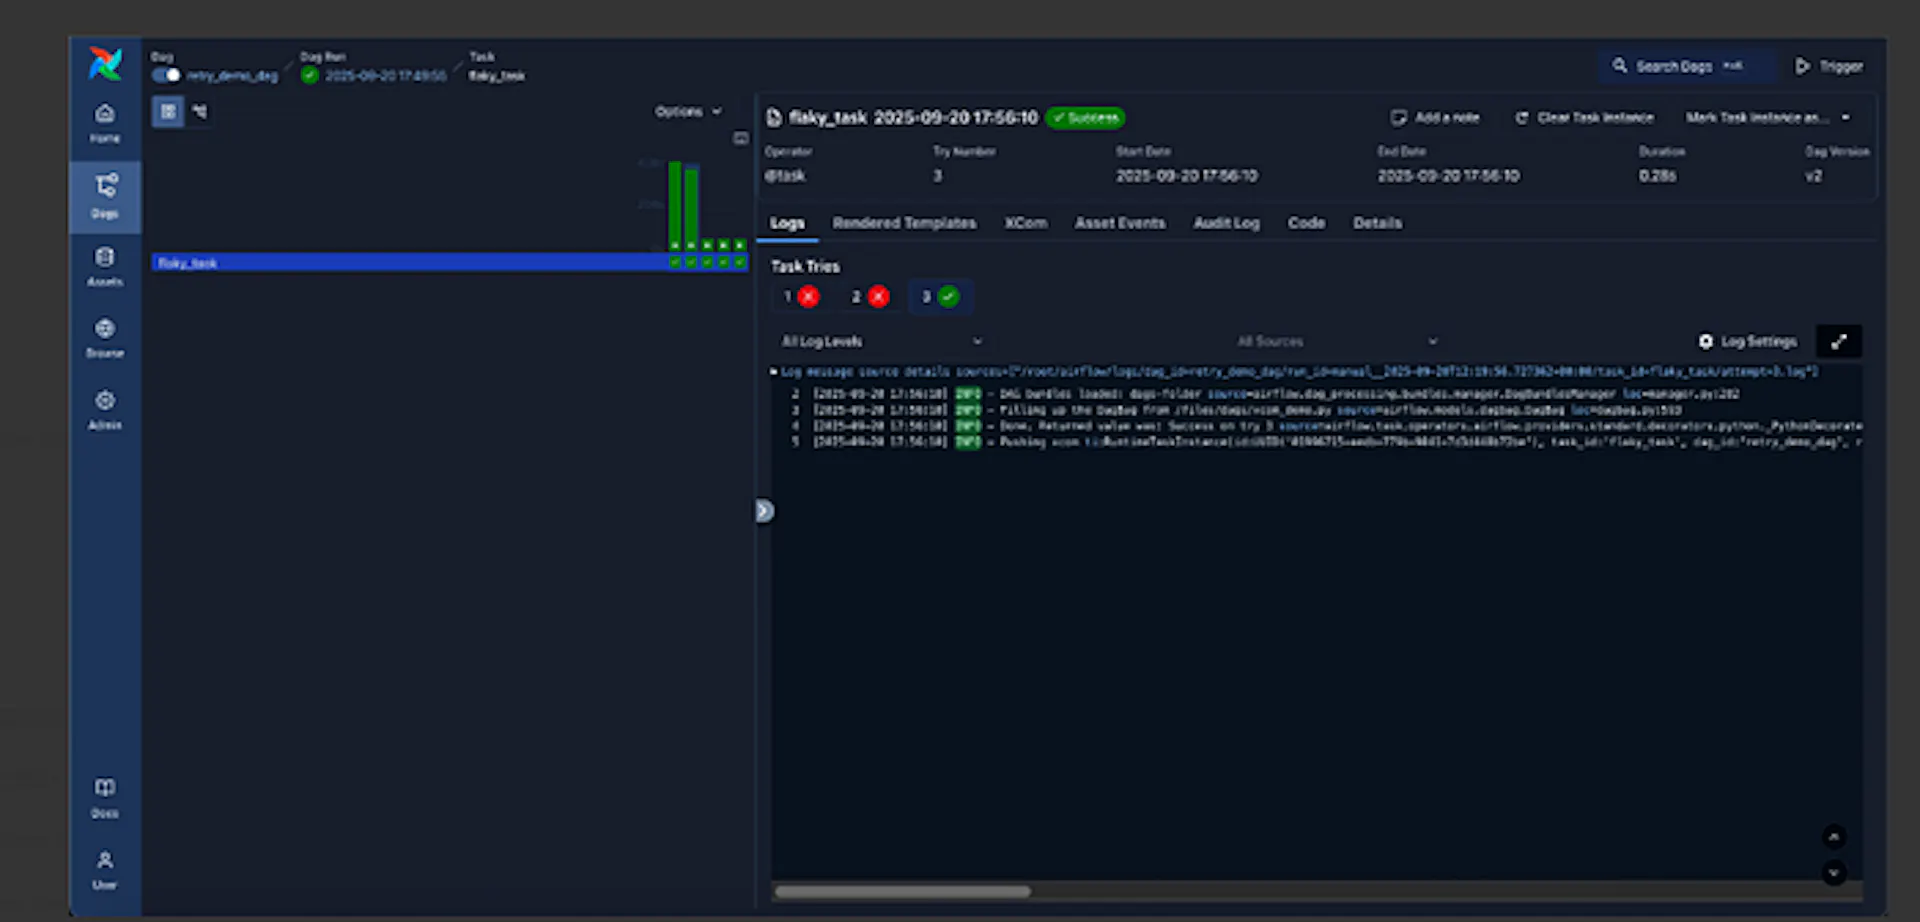 Visual confirmation of pipeline task dependencies inside the Airflow UI
4. Handling Failures and Data Quality at Scale
Even the best-designed pipelines will eventually encounter corrupted payloads, network timeouts, or schema drift. Building resilience requires anticipating these failures rather than reacting to them.
Implementing a Dead-Letter Queue (DLQ)
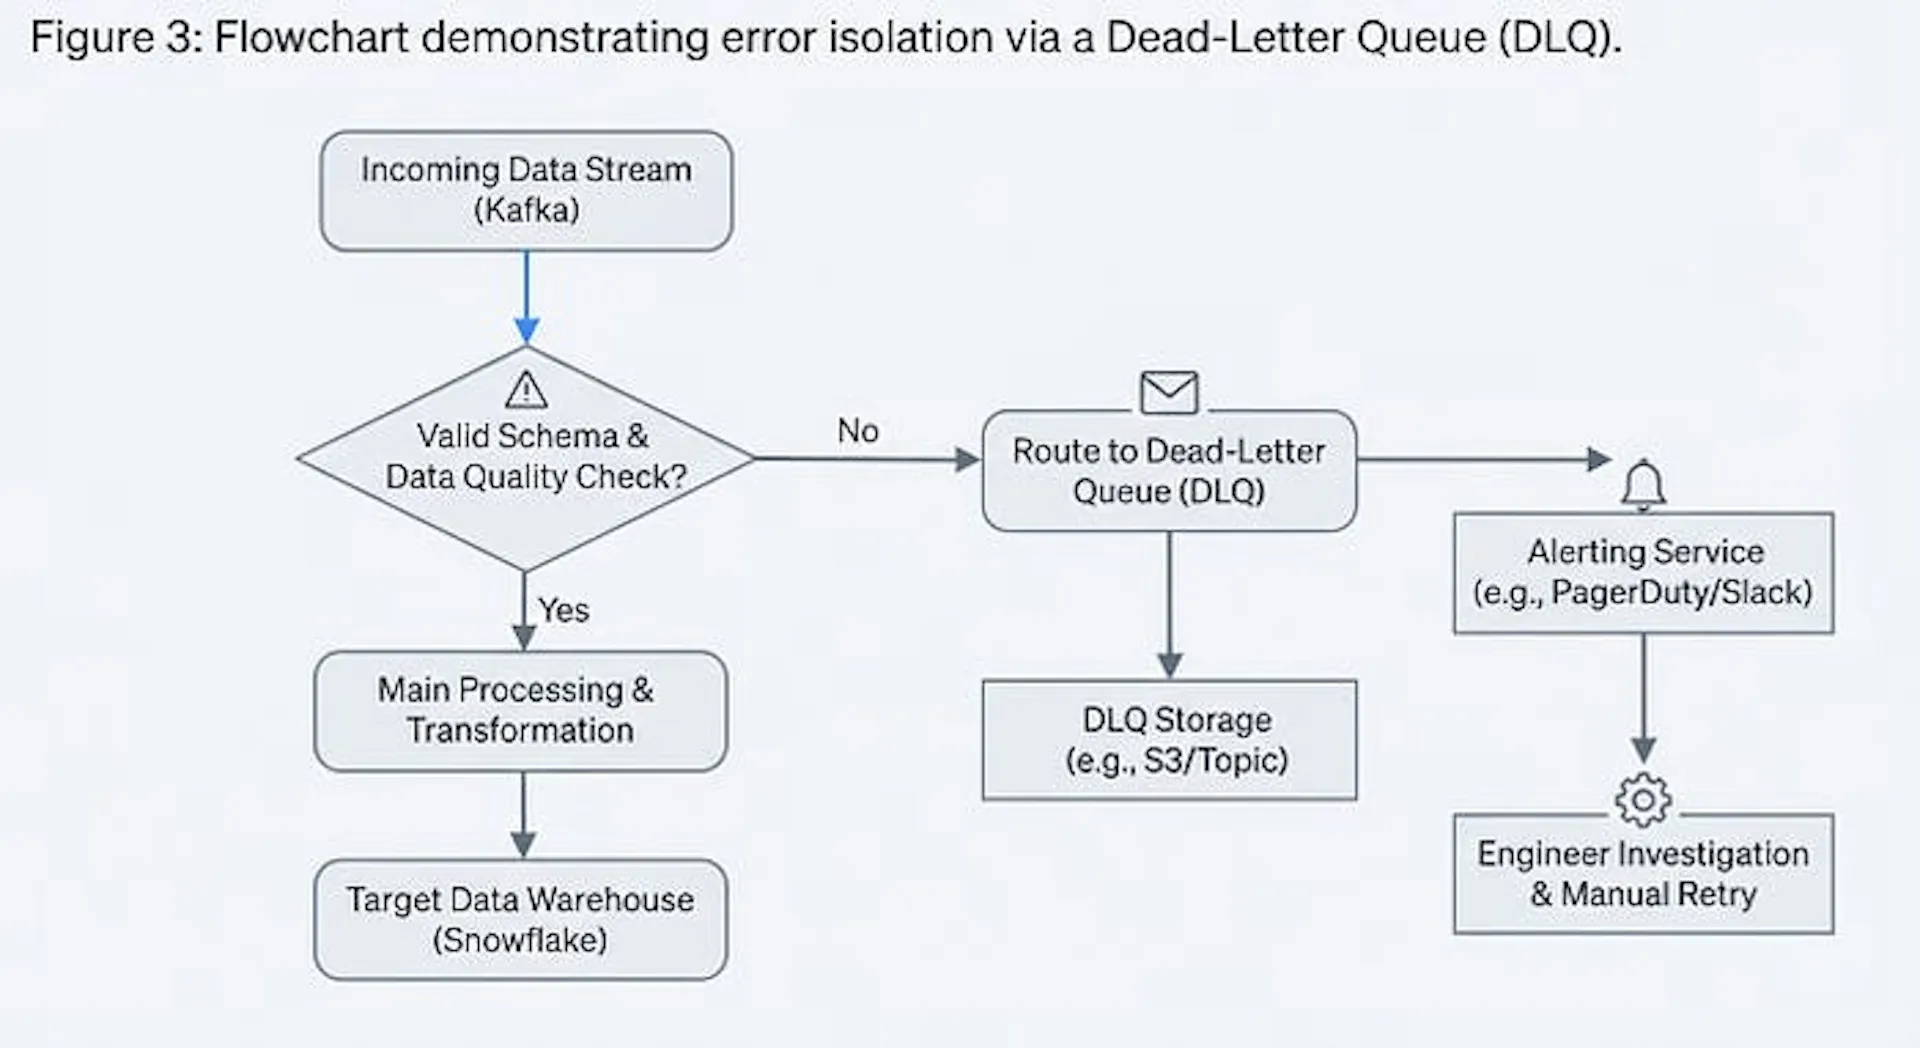
When an ingestion worker encounters a malformed payload (e.g., a missing string field or corrupted timestamp), crashing the entire stream is catastrophic. Instead, route invalid messages to a Dead-Letter Queue.
[ Ingestion Stream ]
       │
       ├──► [ Valid Schema? ] ──(Yes)──► [ Target Warehouse ]
       │          │
       │        (No)
       ▼          ▼
[ Dead-Letter Queue (DLQ) ] ──► [ Alerting & Manual Review ]
5. Data Observability & Monitoring Metrics
You can’t fix what you don’t measure. A modern data pipeline must expose critical telemetry metrics to your monitoring stack (such as Prometheus and Grafana). Keep an eye on these core four pillars of data observability:
- Freshness: How old is the latest data point in the warehouse?
- Distribution: Have row counts or numerical value distributions suddenly spiked or dropped by 50%?
- Volume: Are ingestion rates matching upstream producer output?
- Schema Changes: Did an upstream service drop or rename a column without warning?
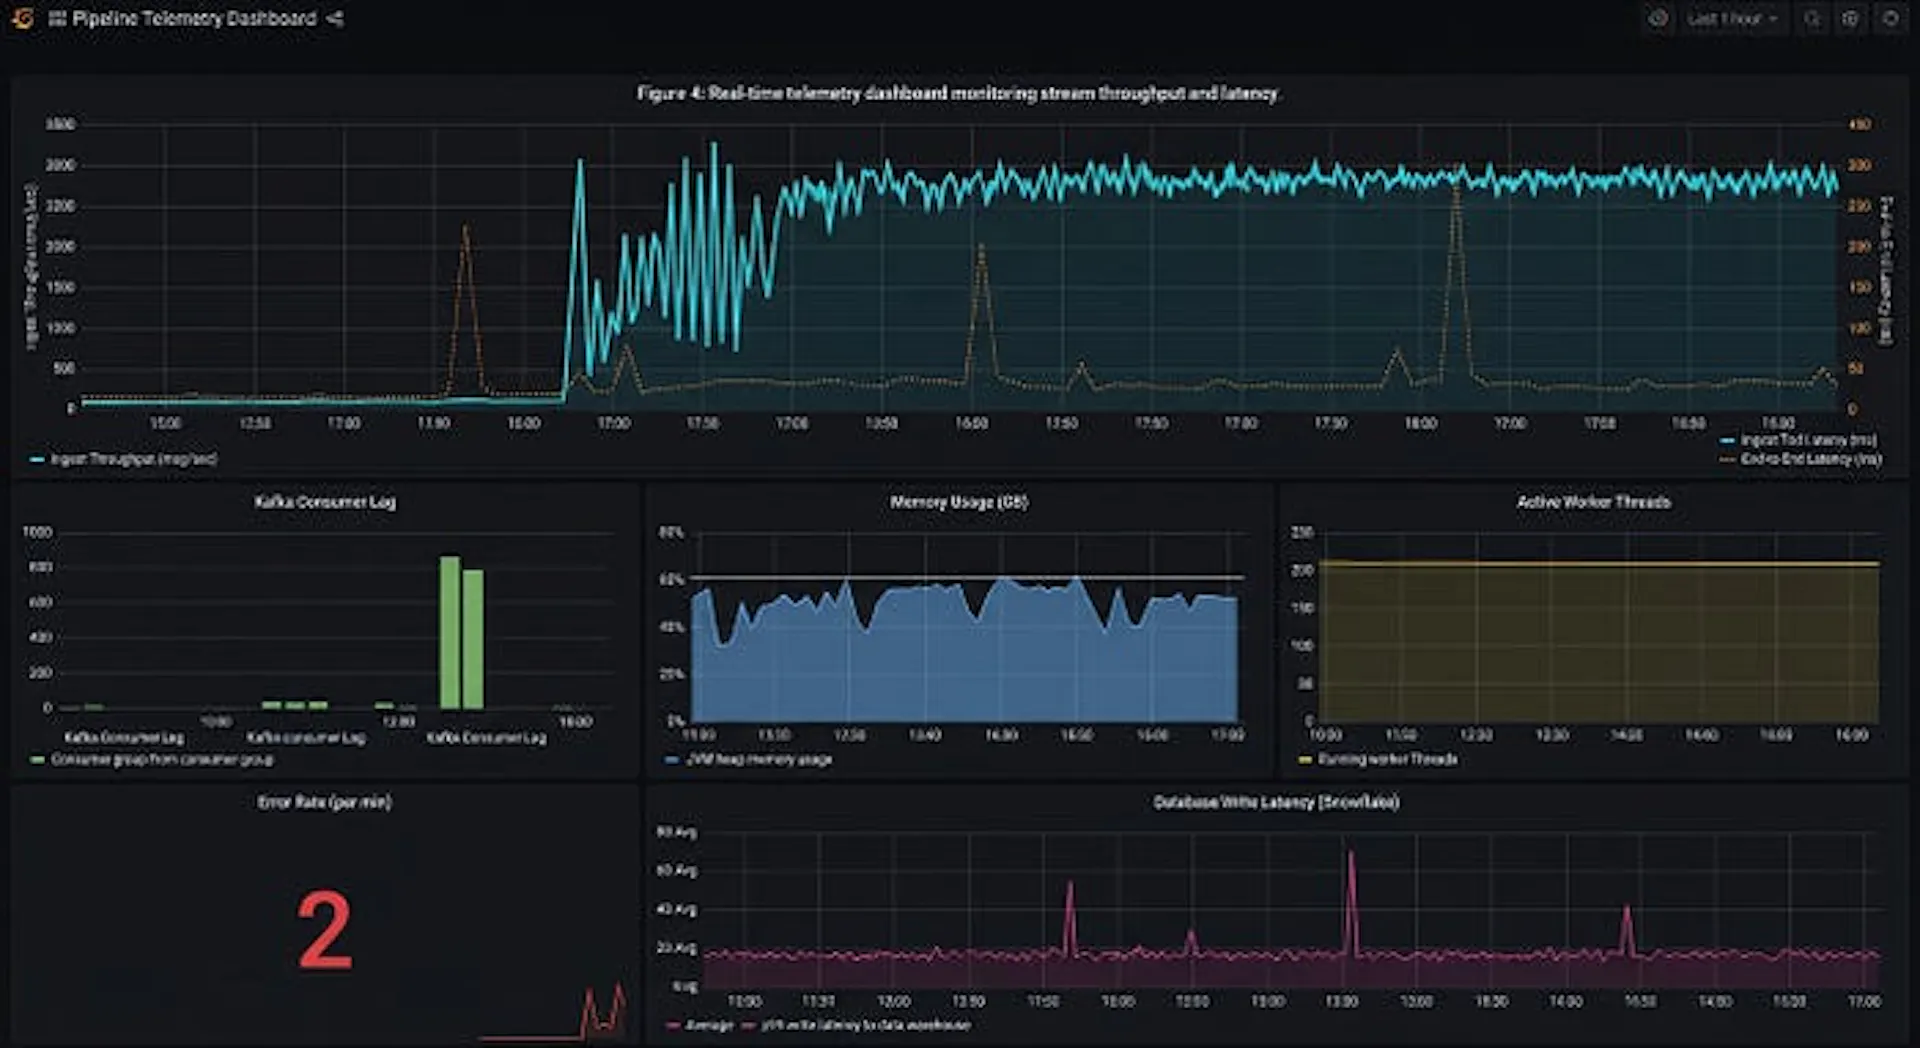 Real-time telemetry dashboard monitoring stream throughput and latency.
6. Conclusion & Key Takeaways
Moving away from fragile, monolithic batch scripts to a modular, event-driven data architecture takes upfront planning, but the long-term payoff is massive.
- Decouple your components: Use Kafka for reliable buffering and Airflow for structured orchestration.
- Expect failure: Implement DLQs and automated schema validation before bad data hits your production analytical models.
- Invest in observability: Make your pipeline transparent so you can catch issues before your stakeholders do.
#Data Engineering, #Apache Kafka, #Apache Airflow, #Python, and #Data Architecture
如有侵权请联系:admin#unsafe.sh