Preface: Field Data Is the Final TruthIn the camera system engineering lifecycle, we have traversed 2026-9-24 06:20:26 Author: hackernoon.com(查看原文) 阅读量:2 收藏
Preface: Field Data Is the Final Truth
In the camera system engineering lifecycle, we have traversed a complete journey. Article 1: Component Selection defined the theoretical system ceiling; Article 2: Lab Build-up & Management established high-precision measurement infrastructure; Article 3: Intrinsic & Extrinsic Calibration built precise geometric awareness for edge AI; Article 4: Factory Testing & AA ensured per-unit quality consistency; and Article 5: Reliability Testing used accelerated life testing to predict and mitigate performance degradation under environmental stress.
However meticulous the test program, labs and factories are ultimately controlled environments. The real test begins once tens of thousands of camera systems are deployed across fleets that span dry heat, severe cold, high humidity, long duty cycles, and high vibration.
The diversity and unpredictability of field environments mean systems will inevitably encounter challenges not foreseen at design time. Article 5: Reliability Testing introduced the concept of IQ Drift — camera performance rarely fails catastrophically; instead it slowly degrades over extended service life. Using the Normalized MTF Index as a conceptual example, Day 0 can be defined as 100, Month 12 as 95, Month 36 as 90; these numbers illustrate trends and are not product specifications or measured field results. AI models may continue to operate, but performance on edge cases may have changed in ways that remain undetected. This gradual degradation is harder to detect and quantify than sudden hardware failure; if it alters model performance, verification with labeled data or other validated methods is still required.
Field deployments may also see AI model drift. Changes in data distribution or concept distribution, shifts in operating conditions, and IQ changes in the imaging system itself can all alter model behavior or performance; these are potential drivers of model drift and observed performance degradation, but should not be conflated with a drop in accuracy. For example, new vehicle taillight designs, regional road-sign styles, or localized haze conditions can produce inputs that differ from training data, and therefore require validated assessment methods to confirm safety impact.
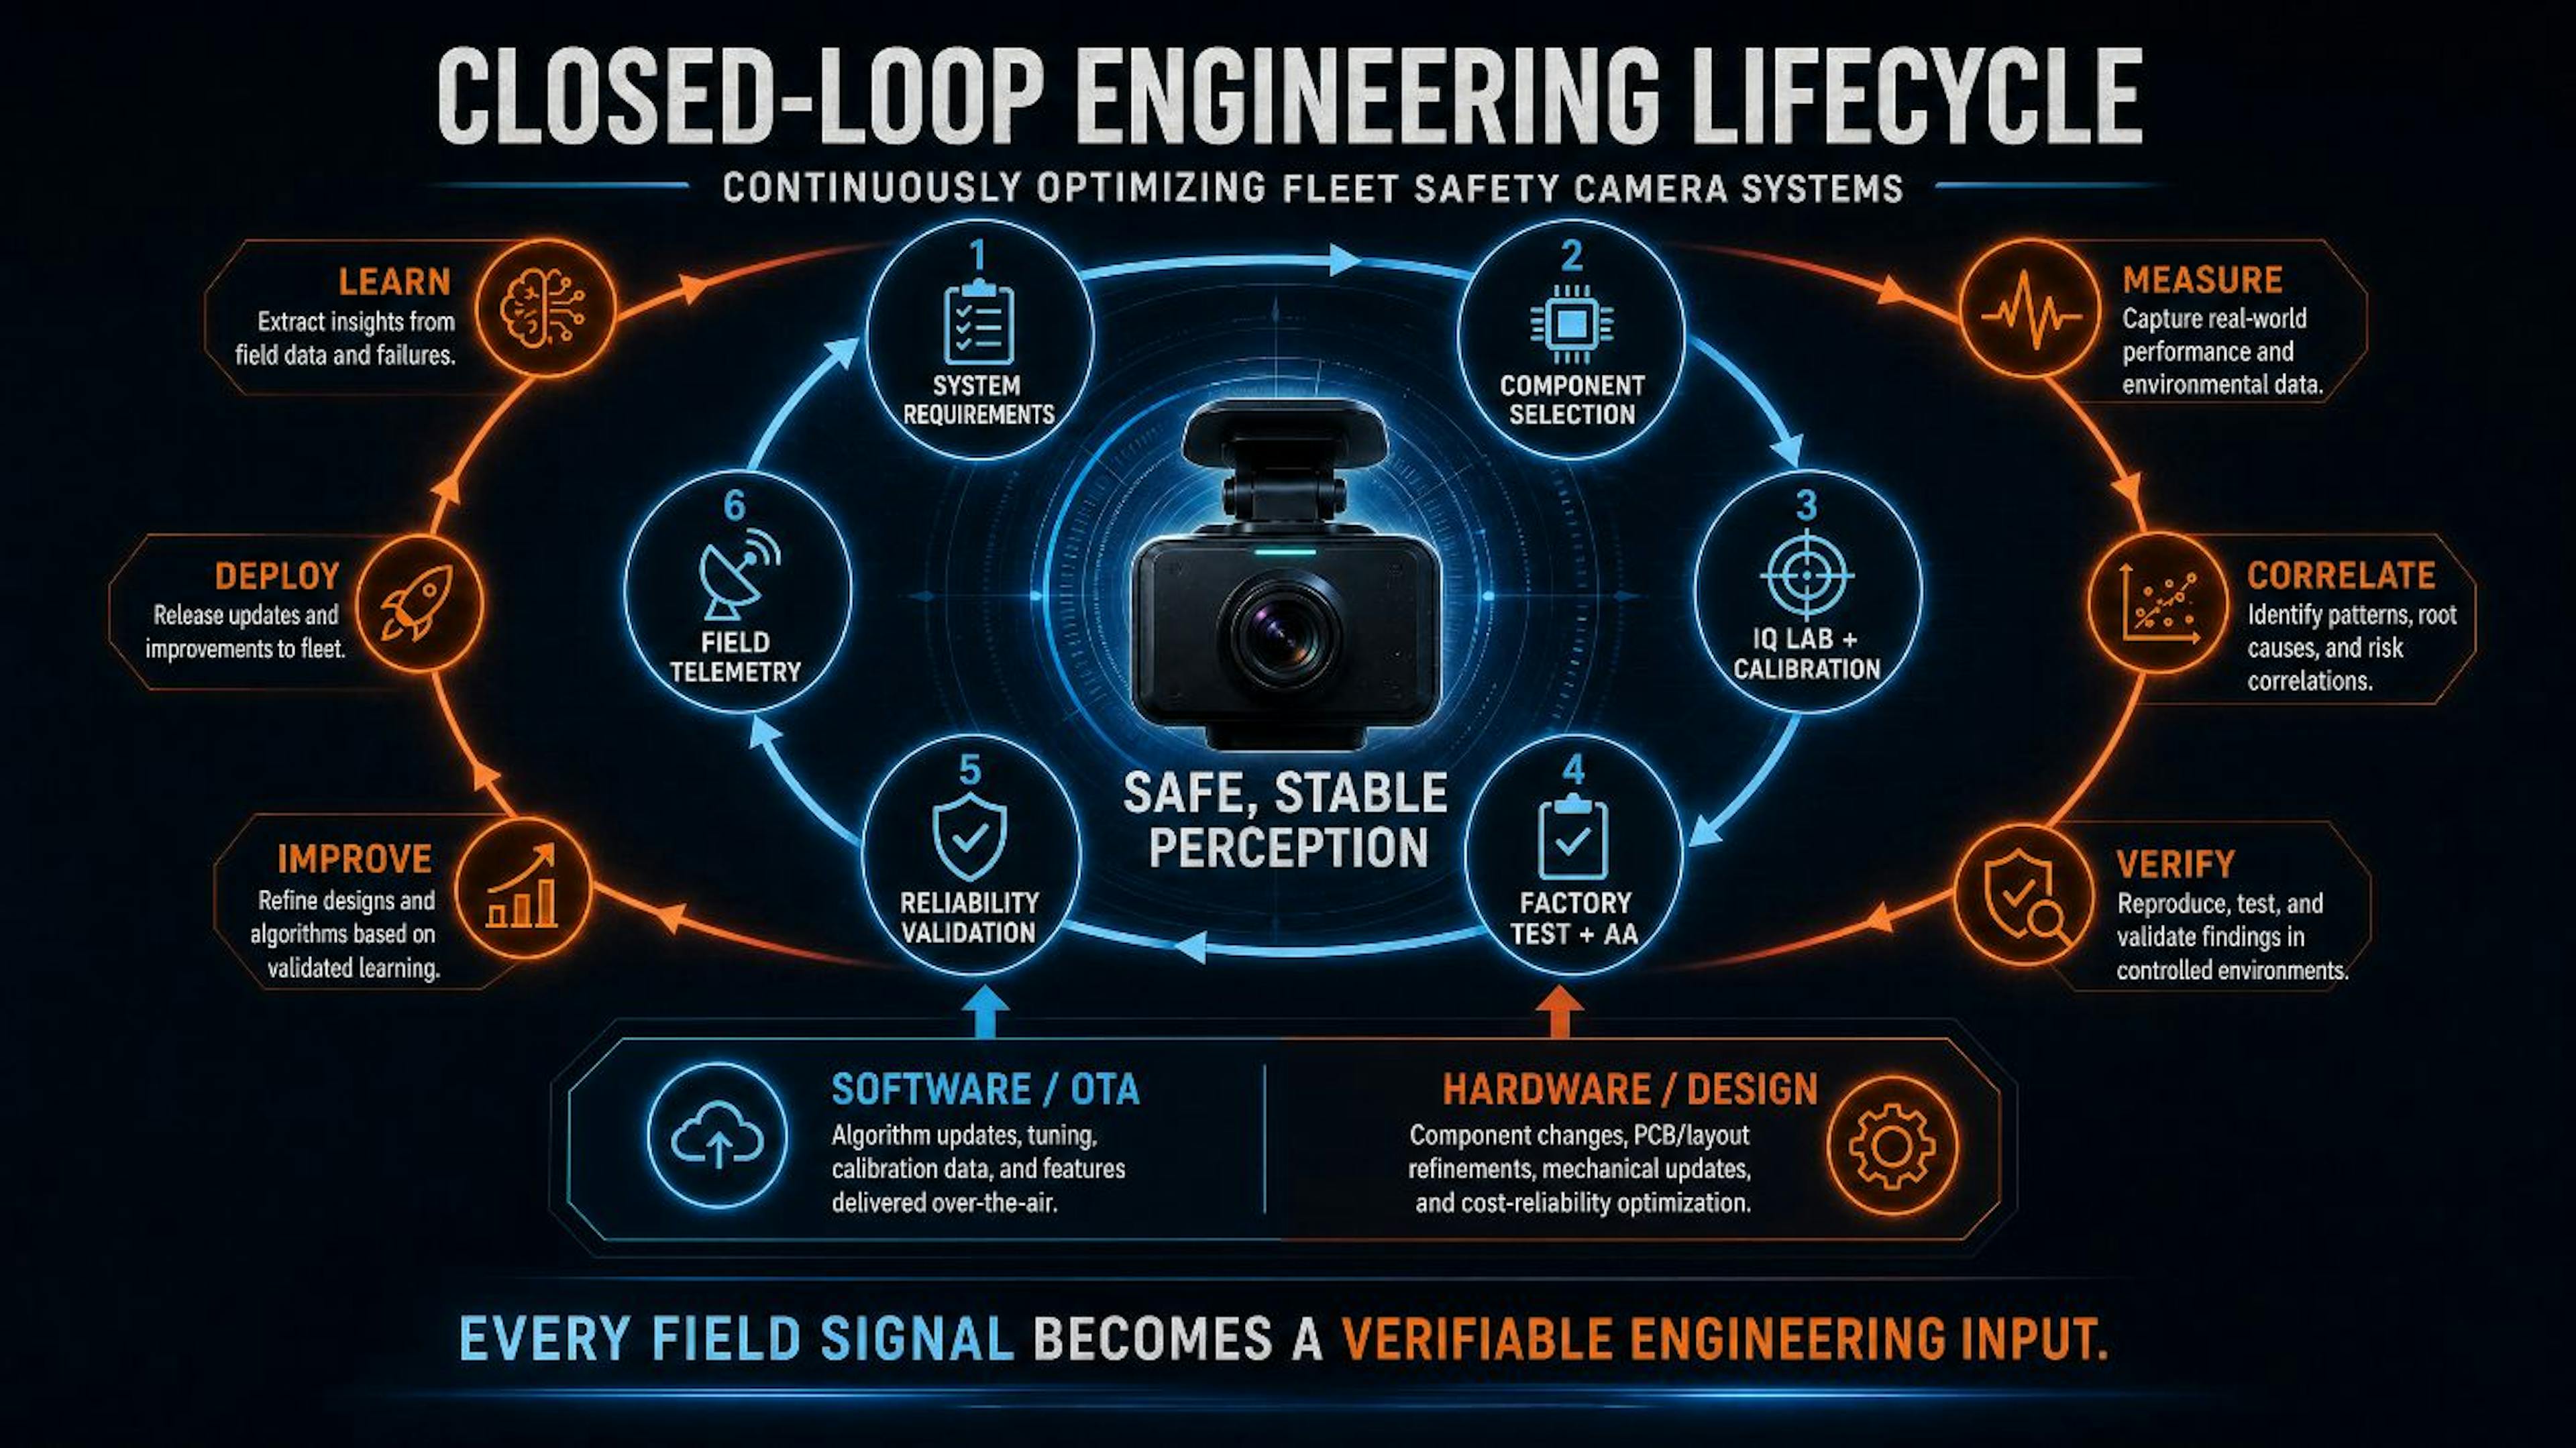
Building a robust customer telemetry system that collects key image-quality and system health metrics from the field, performs rigorous root-cause analysis (RCA) to identify issues, and uses OTA software updates plus data-driven hardware iterations to form closed-loop optimization is a critical engineering capability for long-term success of fleet safety camera systems.
Field data is the ultimate source of real usage evidence; no laboratory can completely reproduce the diversity and unpredictability of large-scale deployments.
Field evidence is not equivalent to controlled validation. Telemetry signals should be used to propose and prioritize engineering hypotheses; root cause, remediation effectiveness, and safety impact must still be confirmed by traceable lab measurements, controlled tests, or labeled-data model evaluations.
1. Telemetry Architecture Design — Edge Computing and Cloud Collaboration
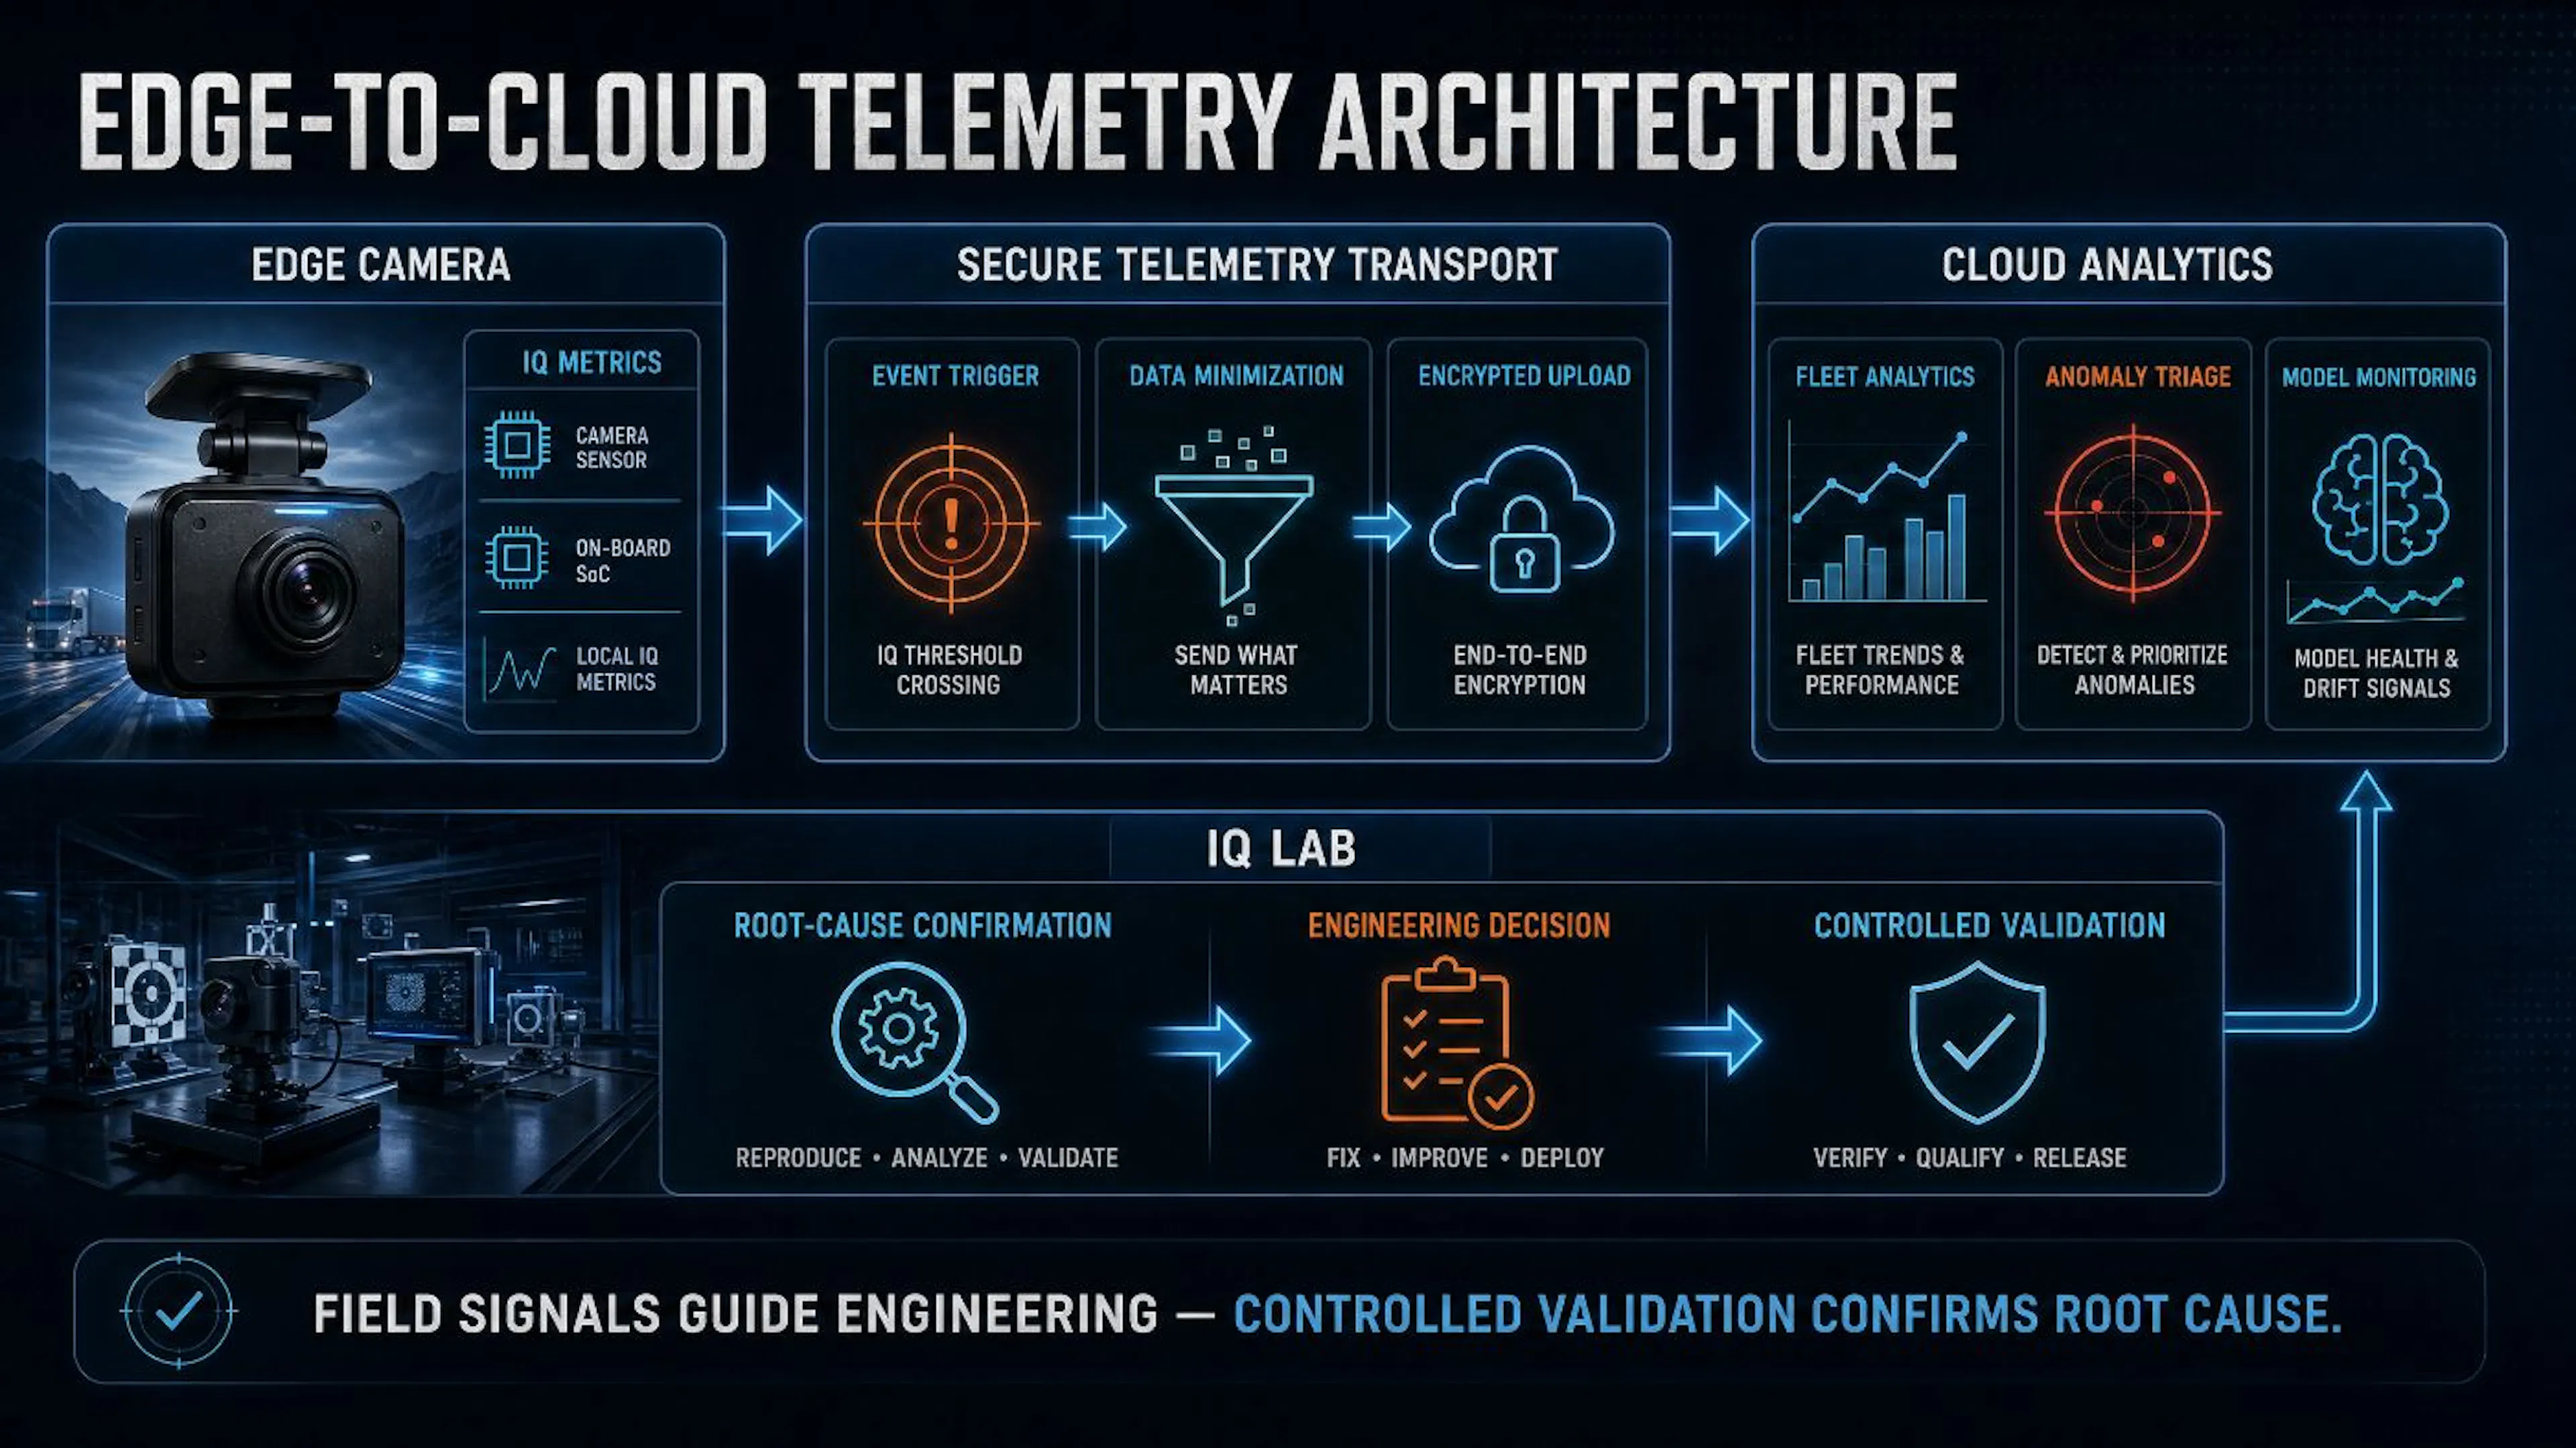 Figure 1: Edge–cloud telemetry, controlled validation, and engineering decision architecture (conceptual). The edge reduces data by event triggering and lightweight indicator extraction; the cloud handles cross-device trends and anomaly analysis. Telemetry results are used to propose and prioritize engineering hypotheses; recalled anomalous samples and labeled evaluations must be confirmed in controlled processes to establish root cause and remediation effectiveness
1.1 Core Design Challenges of a Telemetry System
The core challenge in designing fleet camera telemetry is balancing competing engineering objectives: data integrity (collect as much useful information as possible), transmission cost (cellular bandwidth charges), compute resources (edge SoC compute and power limits), data privacy (driving video contains public scenes and personally identifiable information), and timeliness (some issues require real-time response).
At fleet scale, continually uploading full-frame video is rarely compatible with acceptable bandwidth, cloud storage, and privacy governance costs. Even when on-device compression is used, continuous dual-camera streams accumulate large volumes over time; uncompressed images would multiply the volume substantially.
Therefore, modern telemetry architectures adopt a layered edge-compute and cloud-collaborative design whose core principle is: perform initial analysis and filtering on the edge, and only transmit data with high information density to the cloud.
1.2 Telemetry Capabilities on the Edge
Given budgeted compute, scheduling, and thermal design verification, camera SoCs with AI acceleration can run lightweight telemetry analytics. Edge responsibilities typically include:
Event-driven Image Sampling: The system continuously monitors outputs from AI inference. When events occur — forward collision warnings (FCW), lane-departure warnings (LDW), driver drowsiness alerts, or when the system detects its own anomalies (e.g., inference confidence persistently below threshold) — the system triggers packaging and upload of high-resolution image snippets. This strategy preserves high-value "Moments that Matter" while reducing routine bandwidth; actual uploads remain governed by data governance, connectivity state, and security policies.
Lightweight IQ Metric Computation: The edge can compute and upload compact image-quality statistics without transmitting raw images. Examples include per-frame contrast statistics, luminance histograms, and natural-scene edge–based SFR estimates. These summaries are orders of magnitude smaller than raw images and, once validated, can serve as lightweight signals to track long-term IQ Drift trends.
Hardware Health Monitoring: The edge continuously collects SoC temperature, sensor temperature, supply-voltage metrics, mechanical-vibration features, and privacy-compliant, downsampled or partitioned environmental context, and uploads them at configurable low frequencies. These data are key inputs for later environmental factor isolation and reliability-correlation analyses.
1.3 Cloud-side Analytical Capabilities
The cloud platform ingests telemetry streams from a global fleet and runs statistical analyses that span devices and time:
Fleet-level Statistical Analysis: The cloud can analyze telemetry from tens of thousands of cameras to identify systemic performance trends. For example, if a particular batch of cameras shows a statistically significant decline in average contrast statistics over comparable deployment periods, that could point to differences in optical components, operating conditions, or data composition that merit verification.
Anomalous Device Detection: By comparing a single device's telemetry indicators against the statistical distribution of peer devices of the same model, the cloud can flag anomalous-performing units. These devices become priority targets for deeper RCA.
AI Model Performance Tracking: The cloud aggregates labeled data from human review and continuously tracks model accuracy distributions across scenario categories, identifying scene patterns associated with accuracy decline.
1.4 Designing a Telemetry Metric System
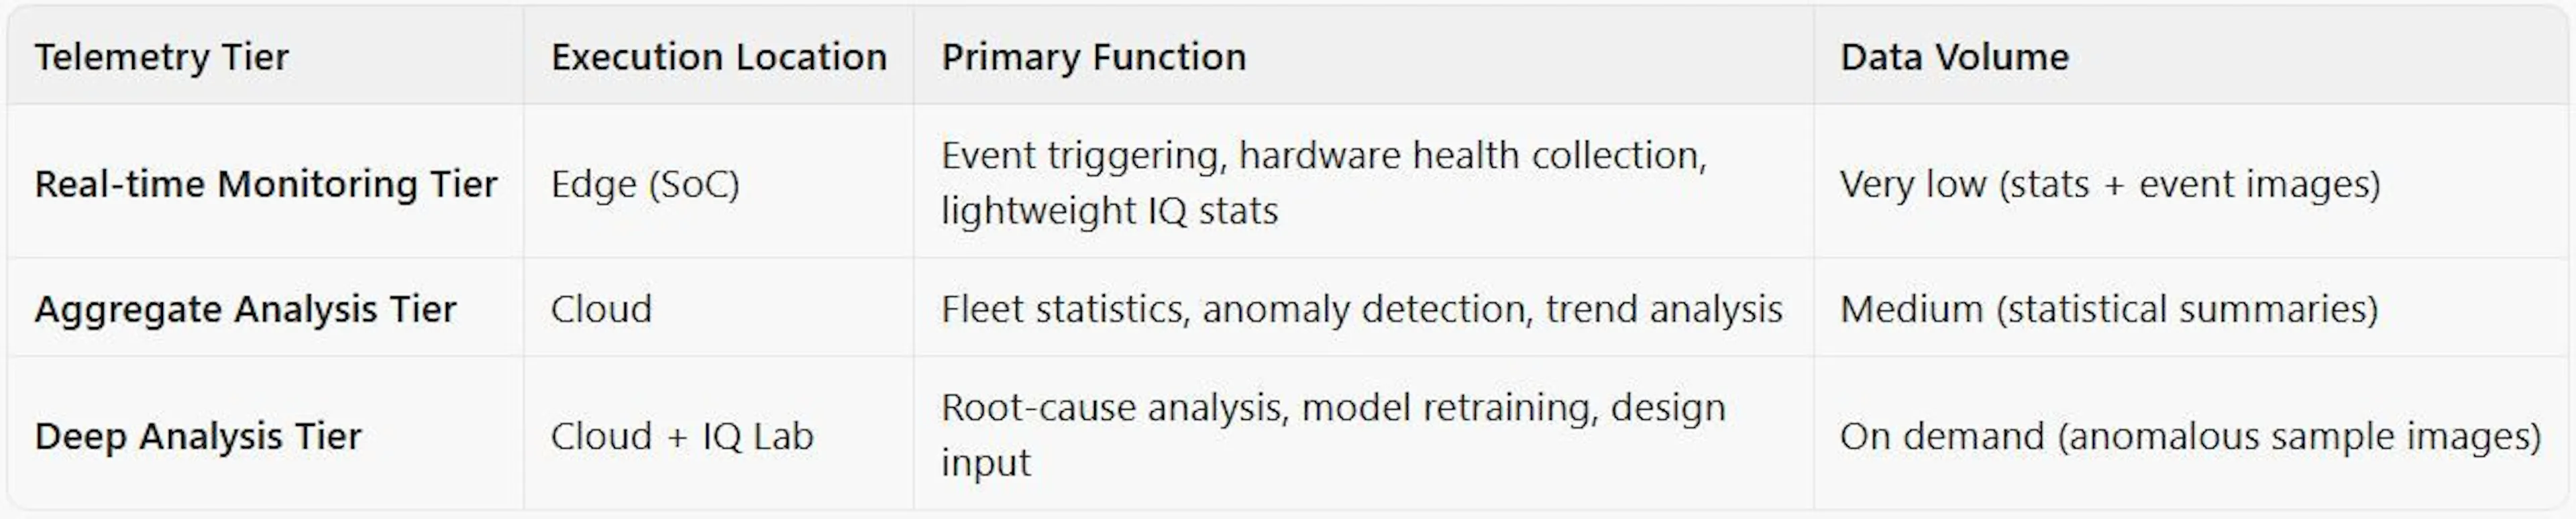
A complete telemetry metric system should cover four dimensions, each with engineering meaning:
IQ Metrics: Track long-term performance of the optical/imaging chain. Core metrics include natural-scene SFR estimates (measuring resolution), scene contrast statistics (proxy for MTF), noise level (SNR estimates), and dynamic-range utilization (highlight/shadow detail retention in HDR scenes).
3A Performance Metrics: Monitor convergence speed and stability of auto-exposure (AE), auto-white-balance (AWB), and autofocus (AF). Abnormal AE settling time, systematic AWB bias, or rising AF failure rate may relate to sensor issues, optical coatings, mechanical structure, scene distribution, or algorithm settings; these signals form preliminary hypotheses, not definitive diagnoses.
AI Model Performance Metrics: Track the edge AI’s confidence-score distribution, event trigger rates, and precision/recall measured via human review.
Hardware Health Metrics: Track SoC and sensor temperatures, supply-voltage stability, vibration spectrum features, and system reboot counts and error-log frequency.
2. Quantifying On-site IQ Drift
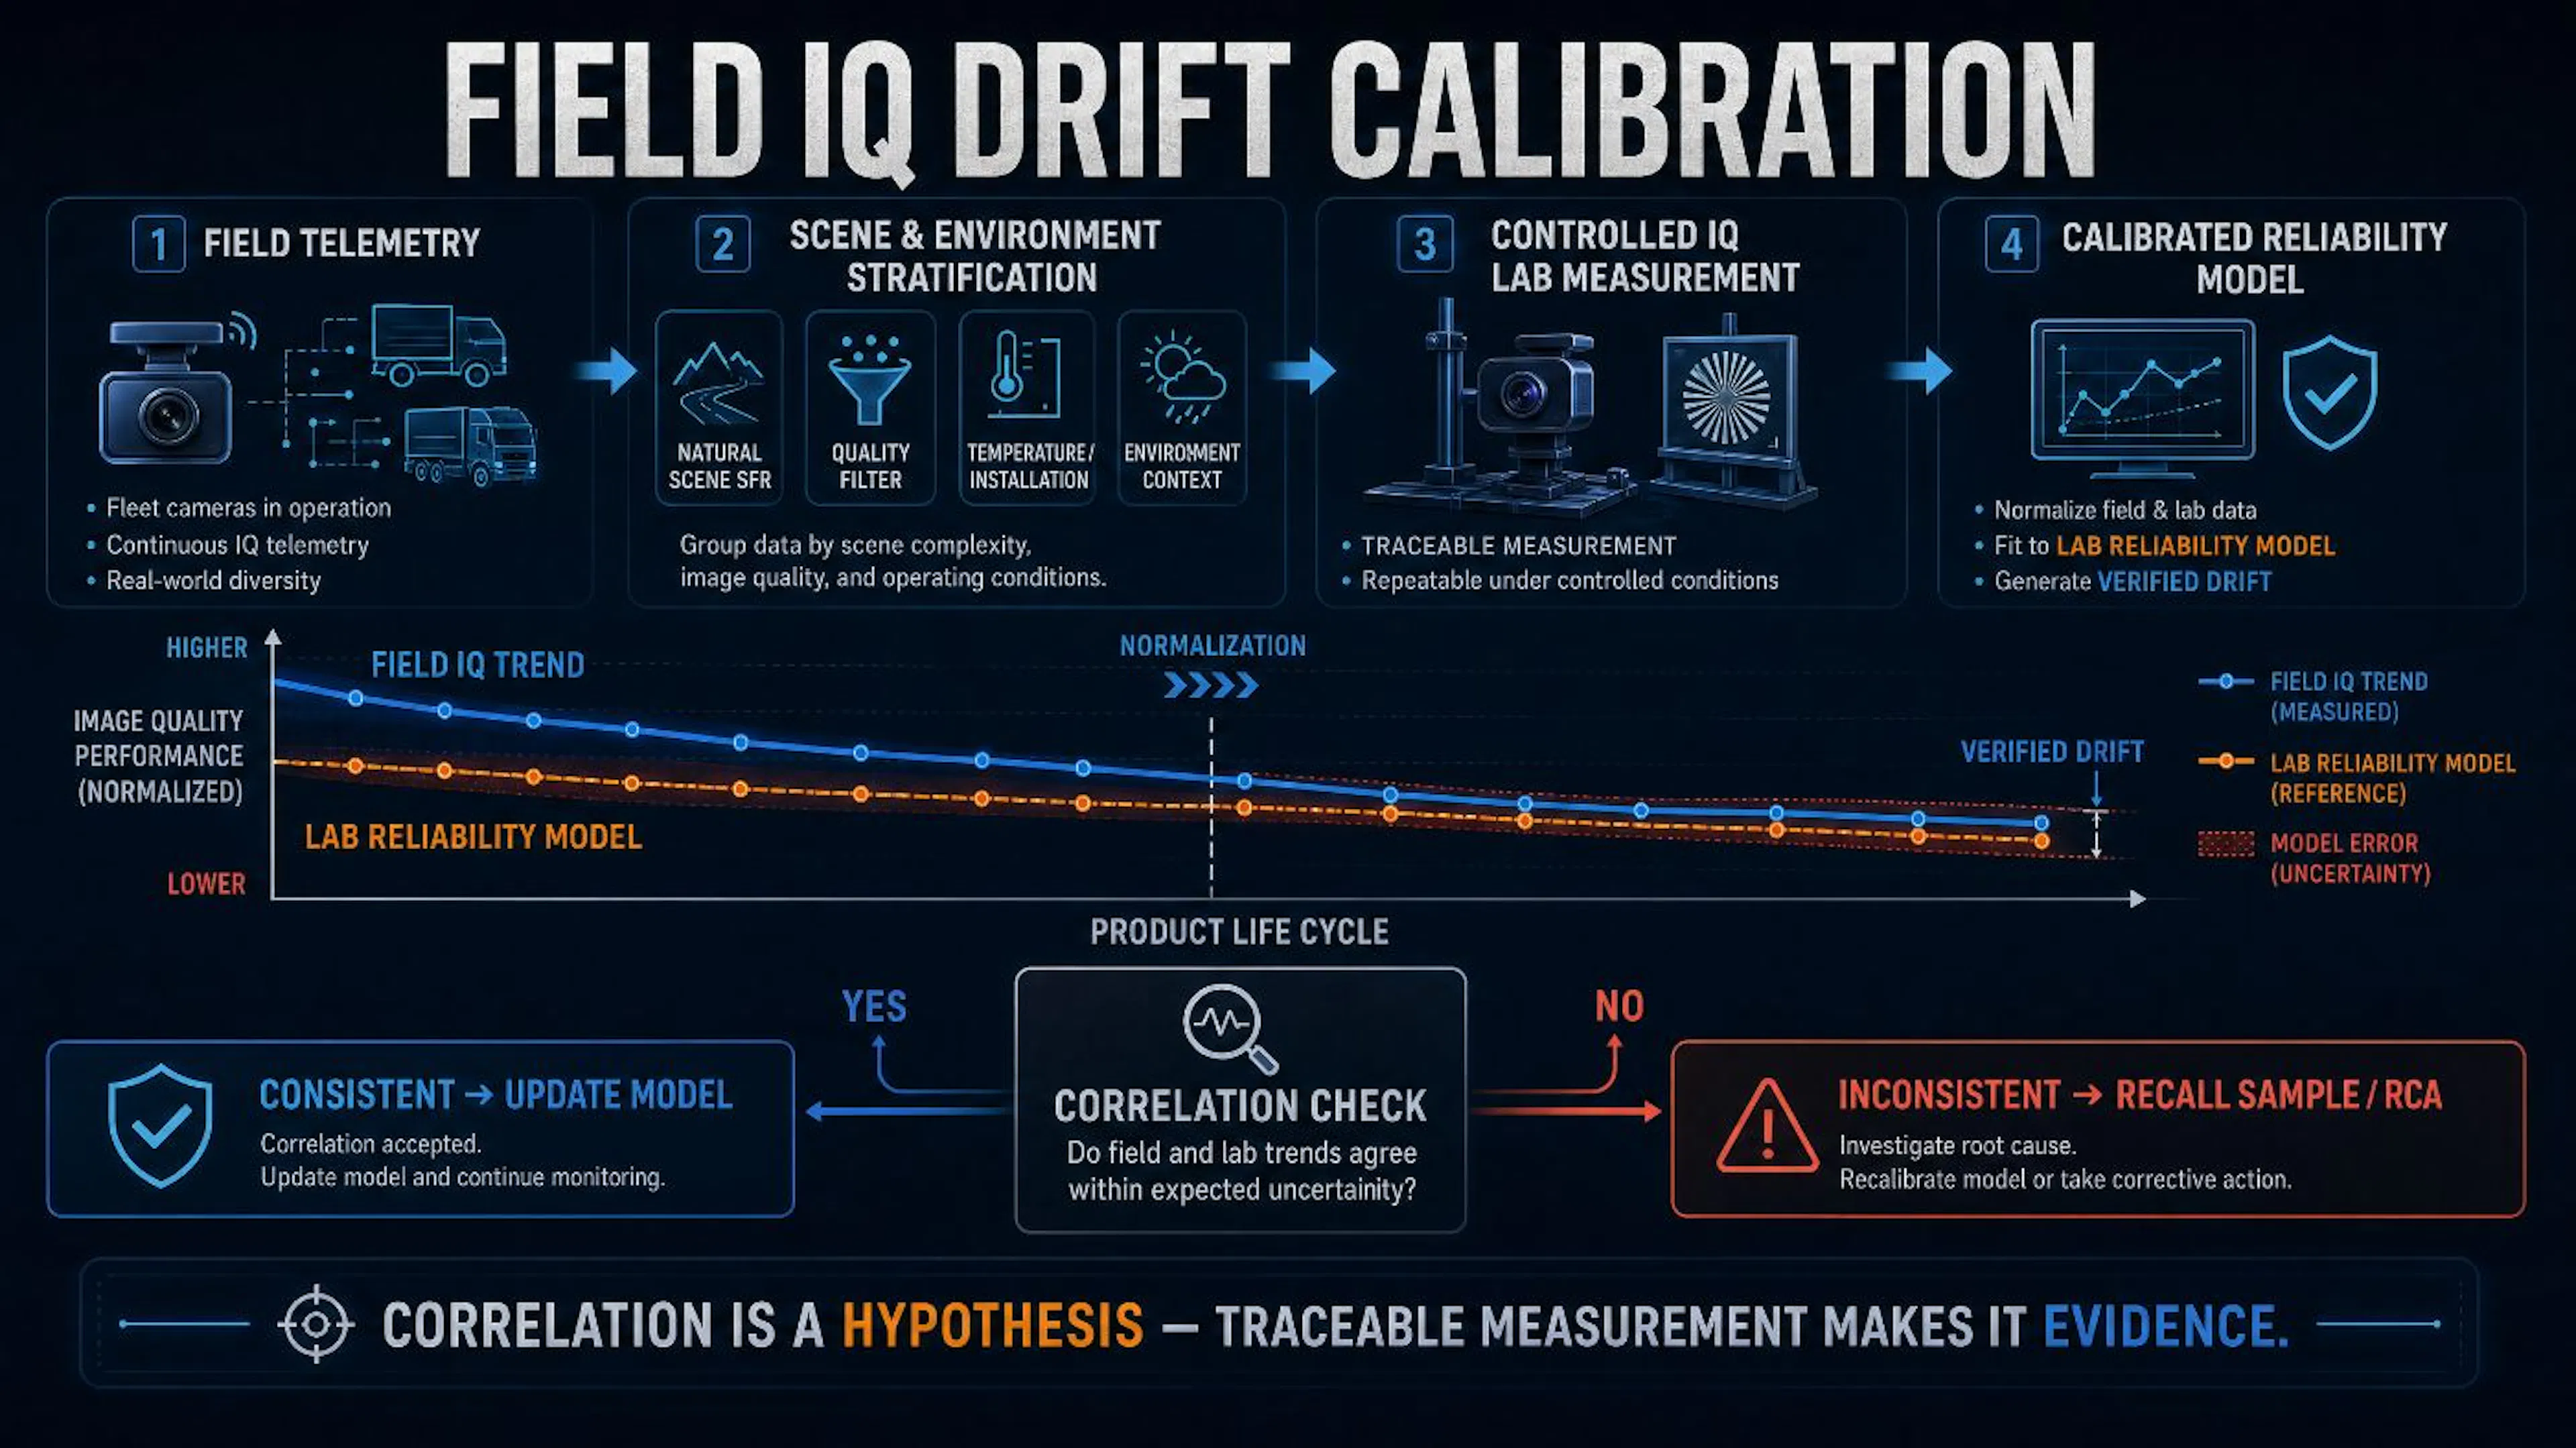 Figure 2: Correlating field IQ Drift with laboratory reliability models (conceptual). Natural-scene SFR and other field IQ statistics must first pass quality filtering, scenario stratification, and environment normalization before comparison to controlled reliability models. When trends disagree, recalled devices must undergo traceable IQ Lab measurements to confirm or refute engineering hypotheses.
2.1 Fundamental Challenges of Field IQ Measurement
In an IQ Lab, you can use standard ISO 12233:2024 eSFR charts, precisely controlled lighting, and stable optical rails to perform traceable absolute MTF measurements. In the field, those controlled conditions do not exist. Cameras are mounted on moving vehicles facing ever-changing natural scenes, variable illumination, and omnipresent mechanical vibration.
Measuring IQ meaningfully in such uncontrolled environments is one of the most challenging engineering problems in telemetry system design.
2.2 Natural-scene SFR Estimation
The core technique for field IQ tracking is Natural Scene SFR Estimation. This method does not rely on chart targets; instead, it extracts sufficiently high-contrast edges (e.g., building outlines, road-sign borders, vehicle contours) from normal driving footage and performs SFR analysis on those edges.
The process is: continuously analyze each frame, automatically detect high-contrast natural edges, and for edges that meet pre-validated thresholds for contrast, edge angle, saturation, and motion-blur conditions, extract the Edge Spread Function (ESF), estimate the Line Spread Function (LSF), and compute the Modulation Transfer Function (MTF).
Because natural-scene edges are lower quality than chart targets, single-frame estimates are noisy. Therefore, the system should aggregate a statistically sufficient and representative sample under predefined scene strata and quality conditions (e.g., median or moving average) to obtain SFR estimates usable for trend interpretation.
The main advantage of this approach is it provides IQ performance data under real usage conditions rather than laboratory ideal conditions. Also, because it uploads only lightweight statistical summaries instead of raw images, bandwidth requirements are minimal.
2.3 Long-term Trend Analysis of IQ Drift
By continuously accumulating natural-scene SFR estimates, engineers can build each camera's IQ Performance Time Series. This time series records the device’s performance trajectory from shipping to the present.
Under normal conditions, the IQ time series should show a slow, explainable decay trend. The Reliability Budget, controlled-stress acceptable drift limits, and lab degradation models established in Article 5: Reliability Testing should serve as prior baselines for telemetry systems, not as direct field-decision criteria. Field data must first be stratified by scene and normalized for environment before comparing degradation slopes, inflection points, and failure modes for consistency; if a device or cohort shows the following anomaly patterns, trigger deep analysis:
Step-change Degradation: Performance drops abruptly and then remains at a lower level. Typically indicates a one-off physical event, such as a severe collision causing lens misalignment, or an extreme temperature shock causing AA adhesive failure.
Accelerated Degradation: Performance declines faster than the batch average. This may indicate an unusually harsh deployment environment (e.g., persistent high temperatures) or a component-quality issue in a specific batch.
Cyclic Fluctuation: Performance shows regular oscillations, often linked to seasonal temperature variation. This pattern helps quantify temperature effects on IQ and verify whether the athermalization design chosen in Article 1: Component Selection meets expectations.
2.4 Isolating and Decoupling Environmental Factors
A fundamental challenge of interpreting field IQ data is distinguishing between true hardware degradation and temporary environment-induced performance drops. A camera operating in dense morning fog will naturally report lower SFR estimates than at clear noon, which does not imply hardware degradation.
To address this, the telemetry system must collect synchronized environmental-context data such as GPS (to infer climate zone), timestamps (to infer illumination), vehicle speed (important for motion blur), wiper state (indicating rain or lens contamination), and SoC temperature (reflecting ambient temperature).
By building a Multivariate Environmental Impact Model, engineers can normalize IQ data for environmental factors. Only after controlling for major known covariates, confirming data quality, and validating this normalization should remaining IQ changes be treated as stronger evidence of hardware-state change.
For example, if a camera, after stratifying for the same scene and environment conditions, still shows SFR estimates persistently below control limits defined by product risk, sample size, and baseline groups, that is a signal warranting deep RCA.
2.5 Calibrating Lab–Field Reliability Correlations
Article 5: Reliability Testing has established a verification chain: IQ Lab baseline → controlled environmental stress → post-stress IQ measurement → fleet-telemetry correlation. This article does not repeat failure modes or accelerated-life-test methods, but focuses on the final link: how to use field telemetry to calibrate models so lab curves become continuously validated predictors rather than one-time qualification gates.
Practically, analysis units should be device cohorts with the same hardware version, similar mounting positions, and comparable usage contexts. The cloud compares normalized field IQ time series against lab-controlled stress degradation curves; the comparison focuses not on single time-point absolute values but on degradation slope, performance inflection points, failure modes, and prediction errors between model and observation. To avoid mistaking calibration error for hardware degradation, recalled anomalous samples must be returned to the IQ Lab built under Article 2: Lab Build-up & Management for traceable measurements.
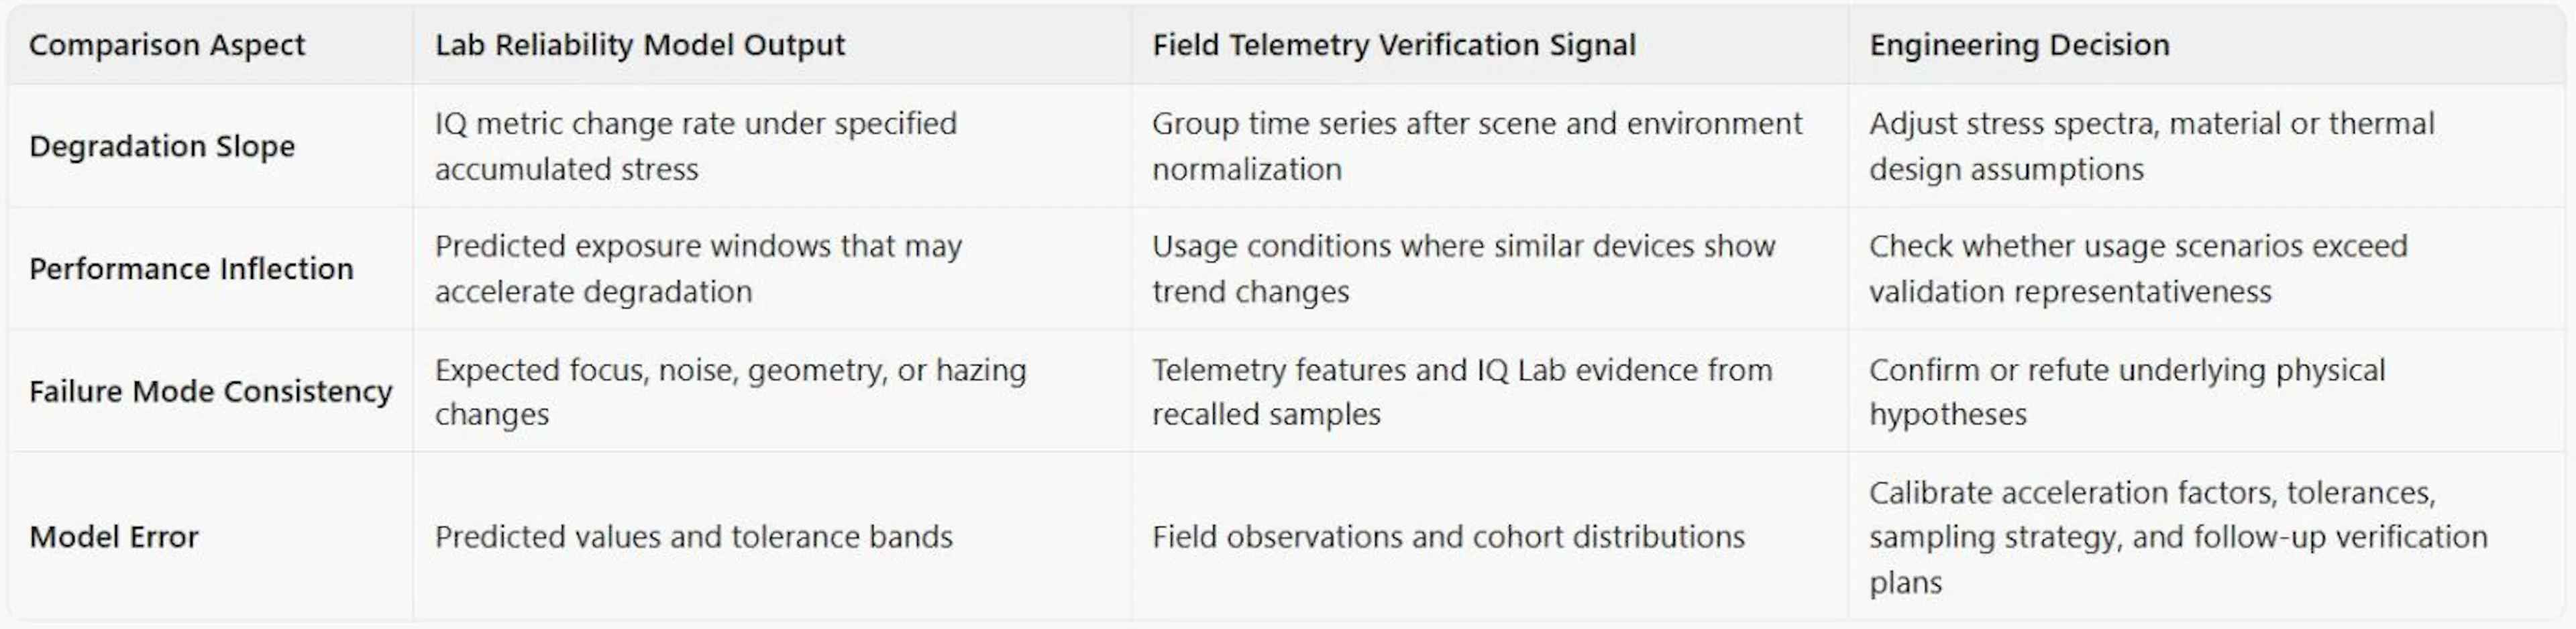
If field degradation precedes model predictions, teams should not treat it only as an isolated quality incident; instead, examine vehicle platforms, mounting positions, road and climate stress spectra, assembly variation, and data stratification that may have been underrepresented. Conversely, if lab results are systematically conservative, reliability governance may adjust acceleration factors or stress conditions. Field data thus become not only failure alerts but quantified inputs for the next round of reliability verification and design decisions.
3. Monitoring and Managing AI Model Drift
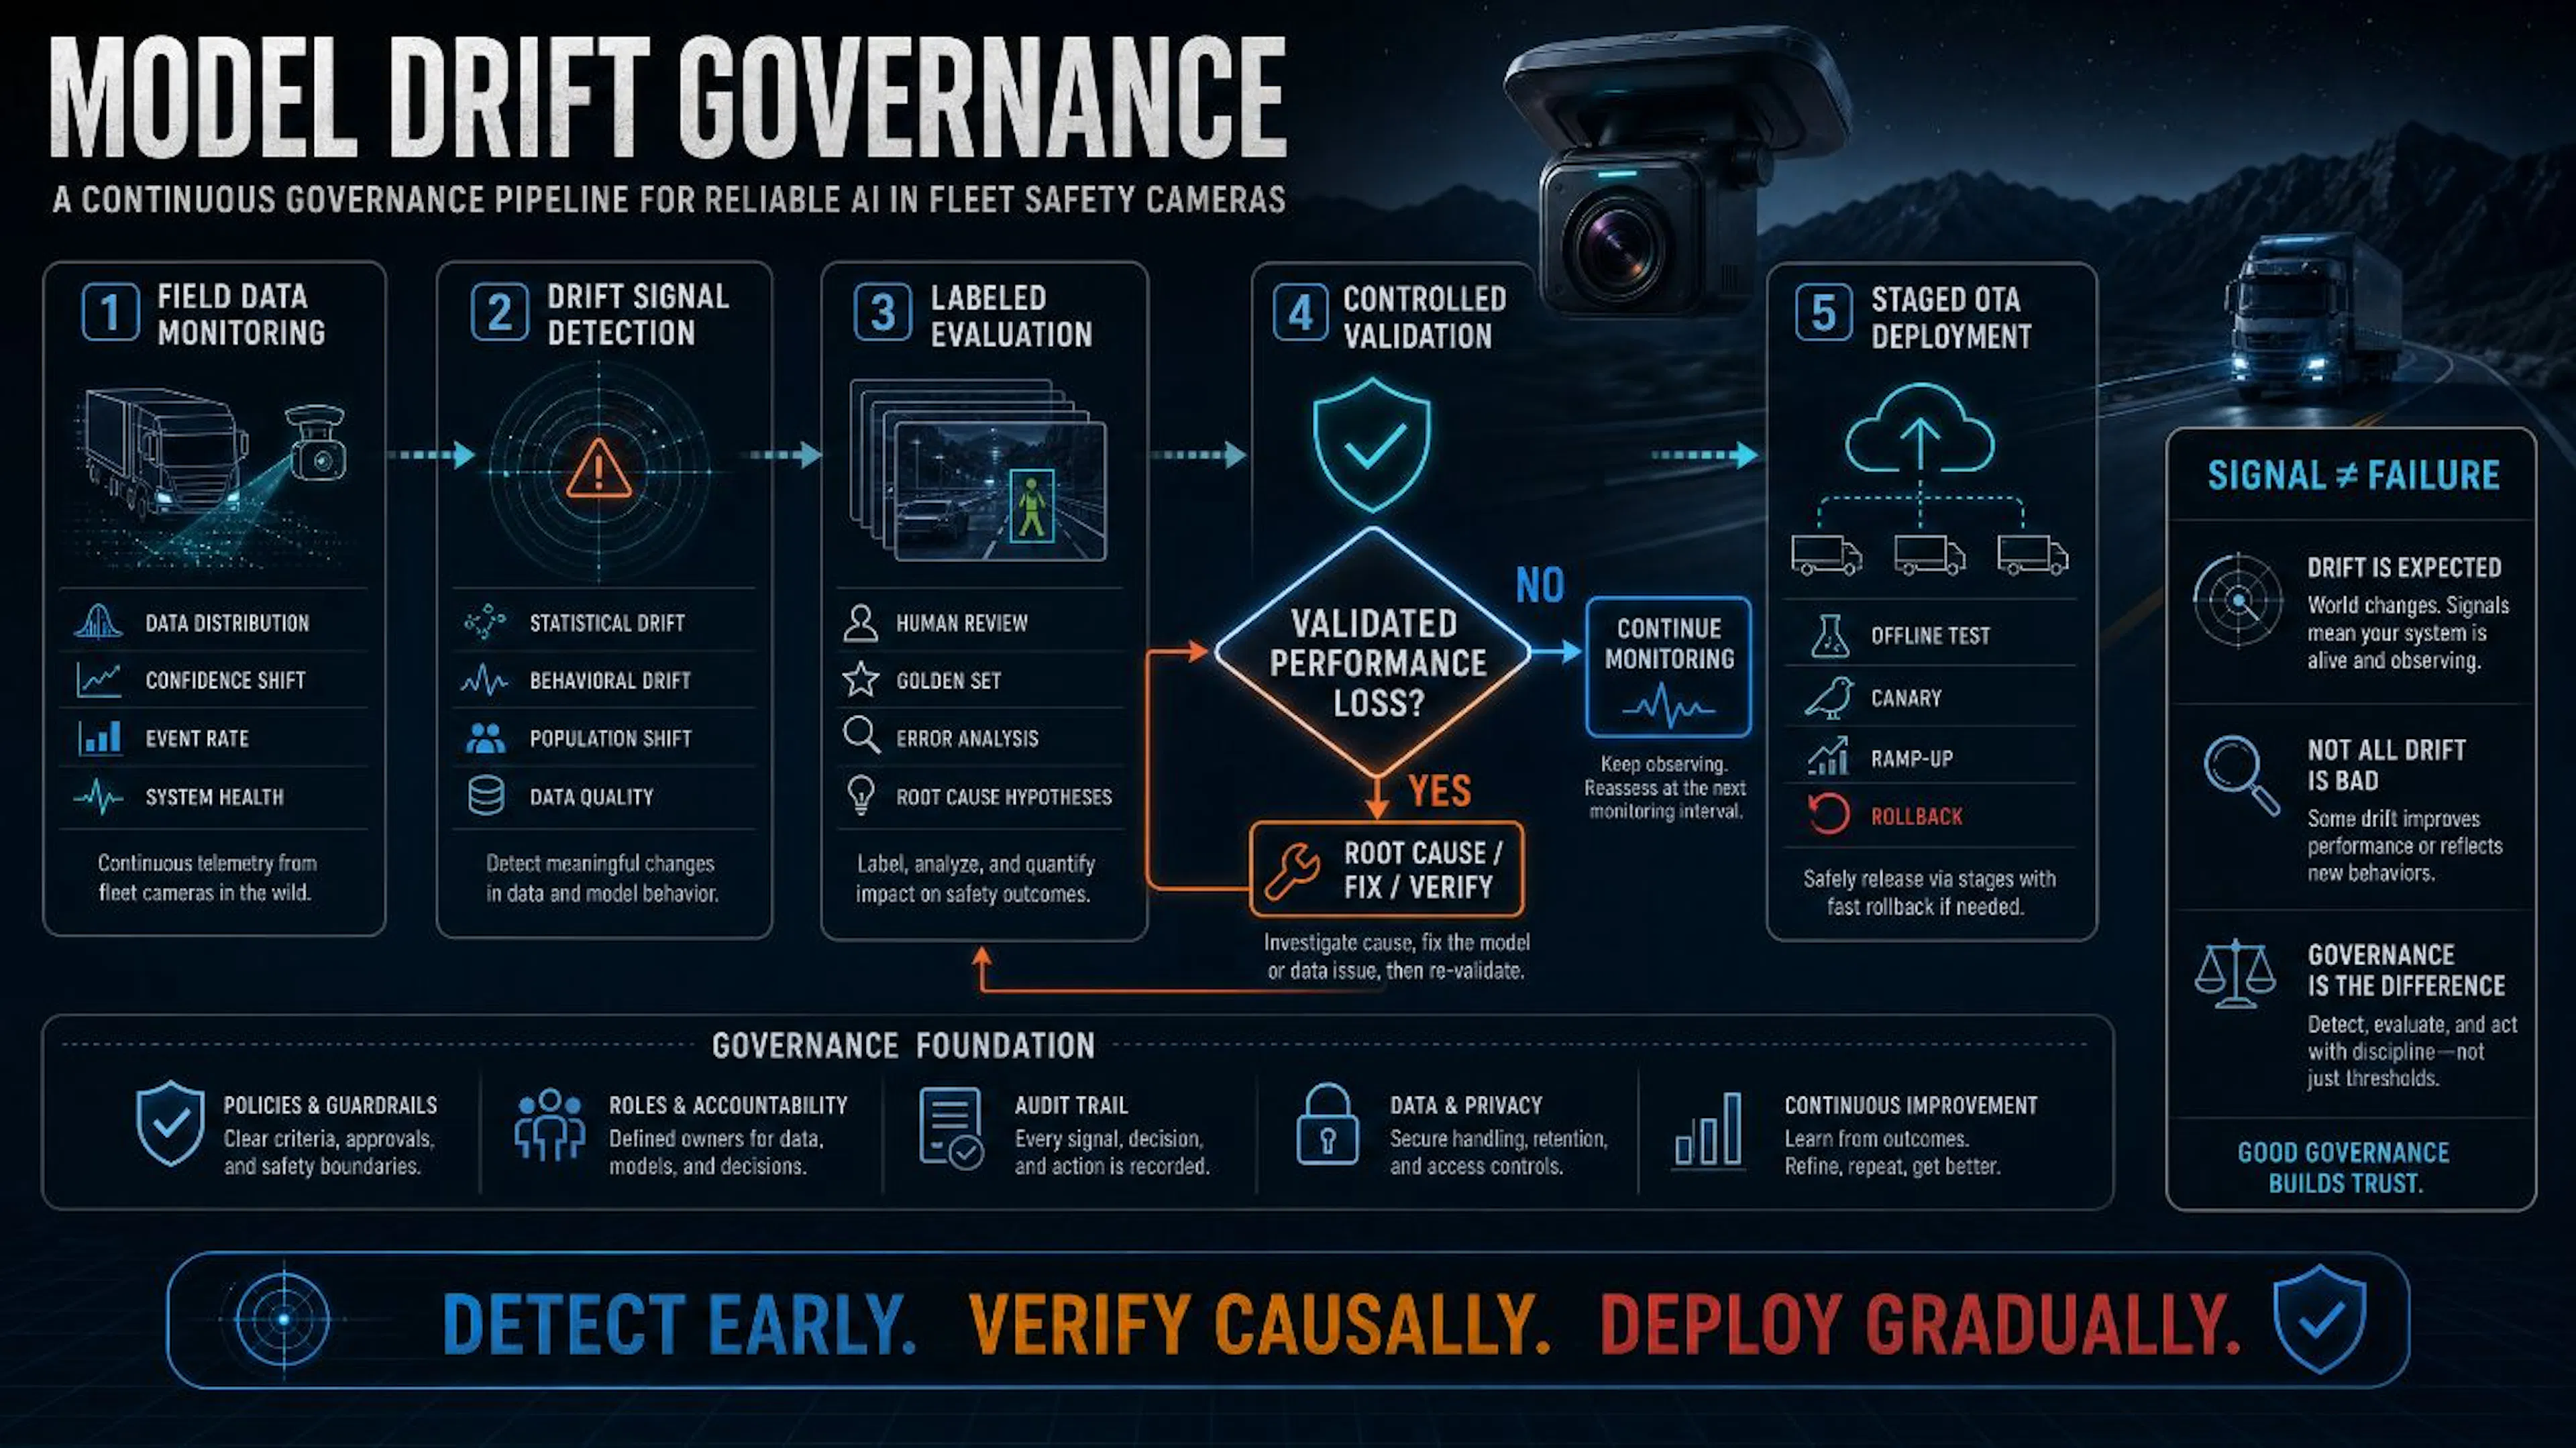 Figure 3: Conceptual illustration of AI model drift monitoring, controlled validation, and staged deployment. Data- or concept-distribution shifts, confidence shifts, and changes in event rates are early warning signals, not direct evidence of performance degradation. Only after performance or safety-critical errors are confirmed using labeled data or other validated methods should root-cause-driven changes to model, ISP, data, or hardware be implemented; risks should be controlled via offline validation, staged OTA, and rollback mechanisms.
3.1 Nature and Risks of Model Drift
In fleet safety systems, edge AI model performance is a key component of system safety. Model behavior and performance after deployment are not static. This article explicitly differentiates Data/Concept Distribution Shift, Model Drift, and Observed Performance Degradation: the first is a change in input data, operating context, or task concept; model drift is the phenomenon of model behavior or performance changing over time; and performance degradation must be measured and confirmed via labeled samples or other validated methods. A common relationship is “distribution shift may cause model drift, which may cause observable performance degradation,” but this path is not guaranteed. Continuously identifying, measuring, and managing these risks across the AI lifecycle aligns with trustworthy-AI risk-governance principles.
For fleet cameras, sources of data or concept distribution shift include new vehicle model designs that change vehicle-appearance distributions, new road-sign designs that change input distributions for recognition tasks, region-specific weather and optical conditions, and IQ Drift that alters the input image-quality distribution feeding the model. These variations should drive stratified monitoring and sampling.
The danger of model drift lies in its subtlety: the system may continue to output predictions but may have unmeasured performance changes in certain scenarios. If labeled-data evaluation confirms accuracy decline, that may be accompanied by rising false-negative rates for a class of hazardous events and must be handled per safety-risk processes.
3.2 Confidence-score Distribution Tracking
One core method to monitor model drift is tracking the AI inference Confidence Score Distribution. When a model’s confidence distribution for a given target (e.g., pedestrian, vehicle, road sign) shifts systematically, it can serve as an early warning for changes in data distribution, image quality, or model behavior.
Concretely, the telemetry system can track per-event mean confidence, confidence-distribution standard deviation, and the fraction of low-confidence events defined by model calibration policy. Confidence scores are not equivalent to accuracy and should not be treated as direct evidence of model drift. If persistent shifts are observed, the engineering team should validate precision, recall, calibration error, and safety-critical error rates through stratified sampling of labeled data, human review, or other validated evaluation methods.
3.3 Human Review Feedback Loop
Confidence tracking can provide early warning of model drift, but accurately quantifying the magnitude of drift still requires a Human Review Feedback Loop.
Under this mechanism, the telemetry system periodically uploads a representative batch of in-field event images (including high-confidence correct detections, low-confidence edge cases, and randomly sampled everyday scenes) for manual annotation by trained Annotators. Comparing the human labels to the AI model’s predictions enables calculation of model precision and recall at the current timepoint.
Executed periodically according to model change frequency, scenario risk, available sample size, and observed alert signals, this process allows engineers to build a time series of AI model performance and to identify the scenario categories where performance changes occur. These results are key inputs for subsequent model retraining and independent validation.
3.4 Active Edge Case Mining
Beyond passively waiting for drift signals, a mature telemetry system should support Active Edge Case Mining. The system continuously analyzes in-field images to identify clips where the AI model’s confidence is low or where model outputs are inconsistent across adjacent frames. These clips often contain novel scenes not present in the training dataset and are a valuable resource for expanding the training set and improving model generalization.
By incorporating these actively mined edge cases into the model retraining pipeline, engineers can continually improve AI model robustness in real-world conditions, forming a continuous learning closed loop of “in-field data → model improvement → in-field deployment.”
4. Root Cause Analysis of In-field Failures
4.1 Failure Classification Framework
When telemetry identifies anomalous devices or systemic issues, engineers must perform systematic Root Cause Analysis (RCA). In-field failures can generally be classified within the following framework:
Optical System Failures: Includes focus shift, edge MTF degradation, lens contamination, and coating degradation. These failures typically appear in IQ telemetry as a sustained decline in SFR estimates and are often correlated with specific environmental conditions (e.g., high temperature or high humidity).
Sensor System Failures: Includes increases in dark current, fixed pattern noise (FPN), proliferation of hot pixels, and dynamic-range reduction due to sensor aging. These failures manifest in telemetry as decreases in SNR estimates and a systematic reduction in AI inference confidence in low-light scenarios.
Mechanical Structure Failures: Includes lens tilt caused by AA glue creep, extrinsic-parameter drift in multi-camera systems, and moisture ingress resulting from seal failure. Such failures may appear in telemetry as reduced model accuracy in specific fields of view or as misalignment in multi-camera stitching.
Software & Algorithm Failures: Includes ISP algorithm failures in specific scenarios (e.g., overexposure in backlight scenes), 3A convergence failures, and model drift. If root cause is determined to be software or algorithmic, the issue can be addressed by a sufficiently validated OTA update; however, if hardware degradation, calibration limits, or data-quality problems are also present, repairs, recalibration, or other hardware measures may still be required.
4.2 Pareto Analysis and Prioritization
When confronted with large volumes of telemetry anomalies, engineers must prioritize investigations effectively. Pareto analysis is an effective tool for identifying the relatively few high-impact problems. By statistically analyzing occurrence frequency, the scope of affected devices, and safety consequences for each failure mode, engineers can identify failure types that disproportionately affect the fleet and prioritize resources accordingly. The actual concentration should be determined by product data rather than assumed fixed ratios.
In fleet safety systems, prioritization must also account for Safety Impact. If risk assessment indicates a failure could affect functions like FCW, its remediation typically ranks higher than a fault that only affects image color reproduction, even if the latter is more prevalent numerically.
4.3 Deep IQ Lab Analysis of Anomalous Samples
For complex failures that cannot be diagnosed from telemetry alone, the most effective approach is to recall anomalous devices and perform deep analysis in the IQ Lab established in Article 2: Lab Build-up & Management.
The IQ Lab’s precision measurement capabilities are critical here. By directly comparing an anomalous device’s IQ measurements (MTF, SFR, distortion coefficients, color reproduction, etc.) against the Golden Sample baseline recorded at shipment, engineers can quantify degradation in each IQ metric and, combined with the device’s telemetry history, reconstruct the failure progression.
This “in-field telemetry anomaly → device recall → IQ Lab deep analysis → root-cause confirmation” flow is the final element of the complete loop described in Article 2: Lab Build-up & Management: IQ Lab → Engineering Validation → Golden Criteria → Factory EOL → Production Monitoring → Customer Telemetry → IQ Lab RCA. IQ Lab is not only an R&D measurement asset but also the lifecycle center for ongoing RCA.
4.4 Correlation Analysis and Isolation of Environmental Factors
After classifying a failure, engineers must also understand the triggering conditions to design effective mitigations. Correlation Analysis is the core tool for identifying potential links between failures and environmental factors.
By performing multivariate correlation analyses between failure rates and cleaned environmental telemetry (temperature, humidity, vibration characteristics, climate zones, etc.), engineers can identify environment associations and candidate triggers worthy of verification. For example, if a camera model exhibits a significantly higher incidence of focus shift when SoC temperature exceeds the product’s defined hot threshold, the cause may relate to thermal design, heat conduction paths into the optical module, or other covariates. Such correlations are not root-cause conclusions and must be verified through recalled samples, IQ Lab testing, and controlled experiments; only confirmed hypotheses should guide thermal path or other design changes in the next-generation product.
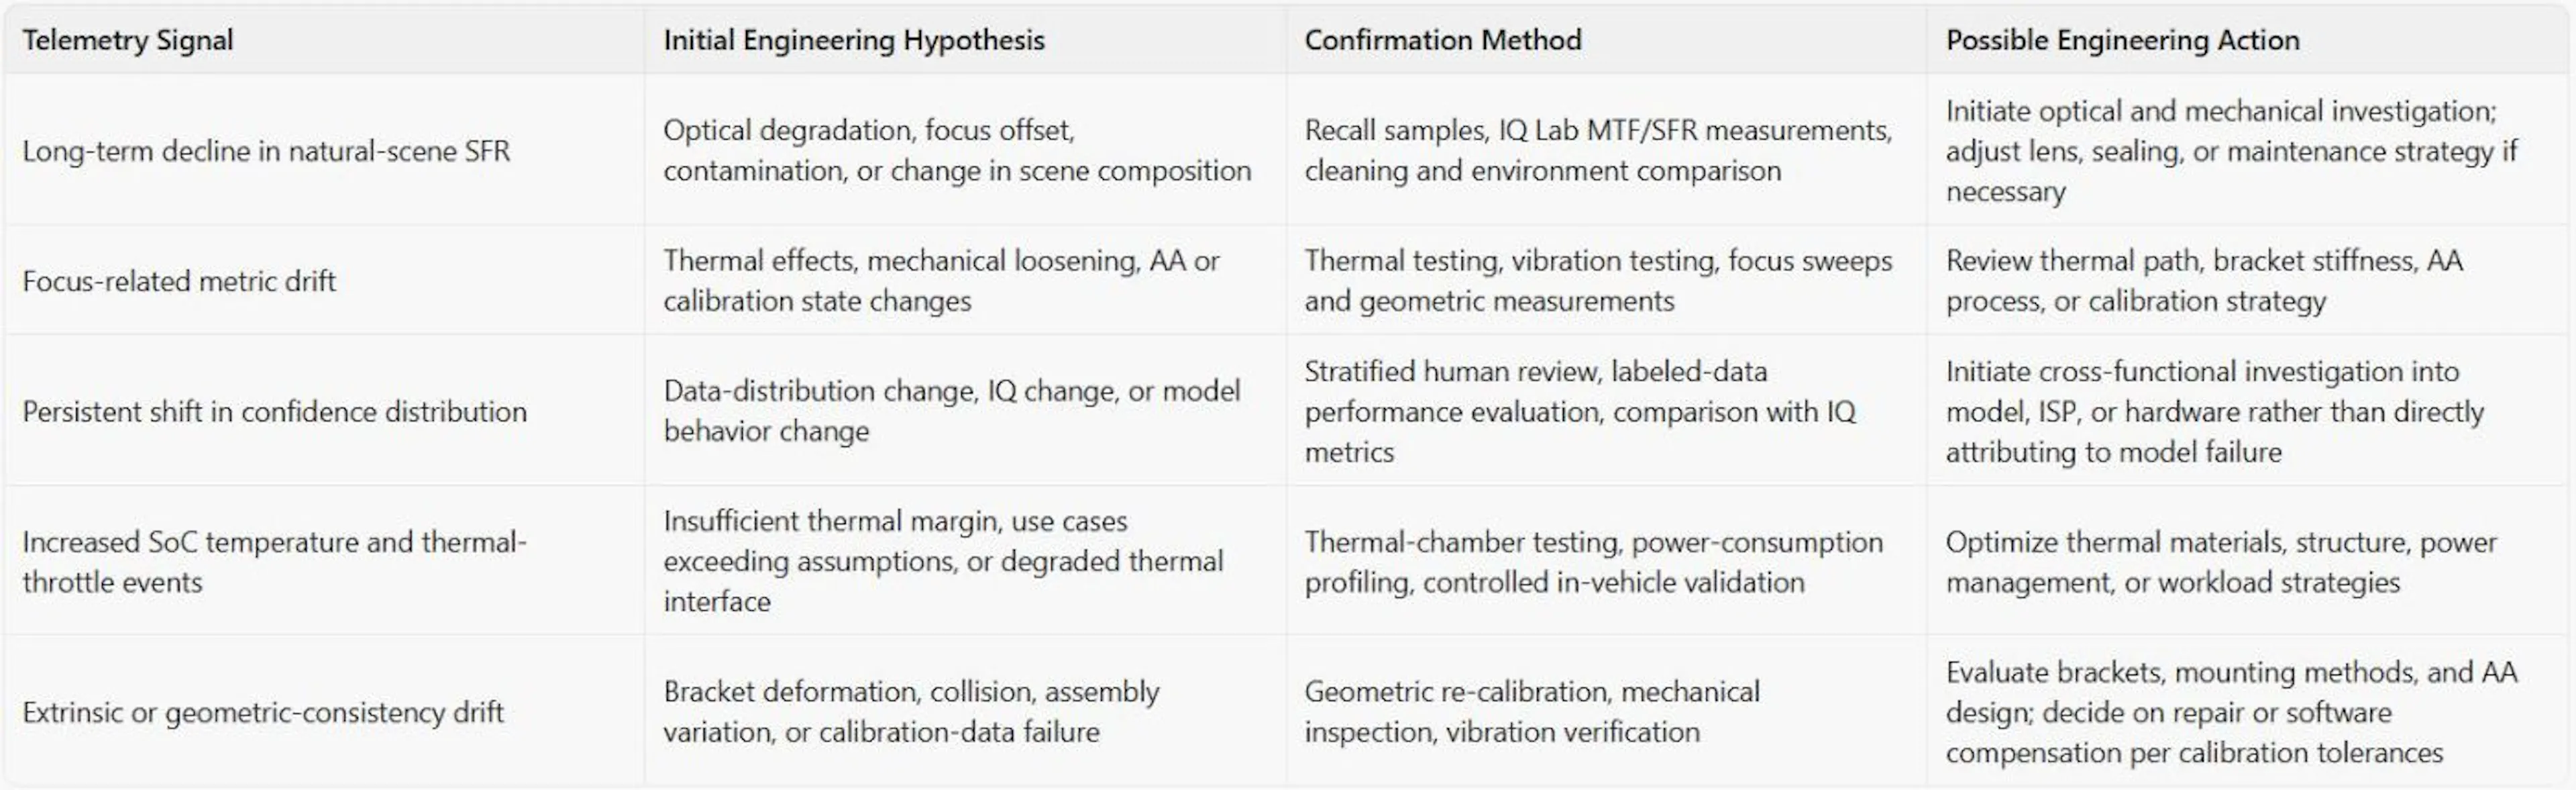
4.5 Telemetry-to-Engineering-Action Matrix
To avoid misusing a single telemetry metric as a diagnostic conclusion, each anomaly signal should be explicitly linked to a preliminary hypothesis, a verification method, and a controlled engineering action. The table below provides a decision framework that can be adjusted based on product architecture, risk analysis, and data governance requirements.
5. OTA Software Update Strategy and Risk Management
5.1 Technical Scope of OTA Updates
Over-the-Air (OTA) software updates are the core tool for rapid in-field response. Compared with hardware fixes that require design, validation, mass production, and product replacement, sufficiently validated software remedies can be staged out to the fleet on shorter timelines. The technical scope of OTA updates spans the full software stack from low-level hardware drivers to top-level AI models:
ISP Parameter Updates: Adjustments to image signal processor parameters, including denoising strength, tone curves, and color matrices. For example, if telemetry shows that an AWB algorithm misclassifies snowy scenes as color-temperature shifts in winter at certain latitudes, engineers can correct scene-recognition weights in AWB via OTA.
3A Algorithm Optimization: Updates to auto-exposure, auto-white-balance, and auto-focus control algorithms. For instance, optimizing AE metering strategies for high-contrast backlight scenes in specific regions can improve image usability in HDR scenarios.
AI Model Updates: This is the most technically complex OTA domain. Model updates can be performed as Full Model Replacement or Incremental (Delta) Updates. Incremental updates transmit only the model differences, significantly reducing package size and lowering bandwidth and storage demands, but they impose higher requirements on model architecture stability.
Calibration Parameter Updates: When hardware remains within validated calibration tolerances and mechanical stability ranges, and telemetry plus follow-up measurements confirm a systematic geometric-calibration bias in specific batches, validated intrinsic and extrinsic matrices can be pushed via OTA for controlled software compensation. Such updates must not substitute for repairs of lens displacement, structural deformation, seal failures, or other physical faults; any device outside the validated calibration envelope should enter recall, repair, or replacement workflows.
5.2 Progressive Rollout and A/B Testing
The largest OTA risk is scale: a flawed update can affect tens of thousands of devices globally within hours. Therefore, OTA rollouts must follow a strict Progressive Rollout strategy:
Lab Regression Testing: Before any OTA push, the update must undergo comprehensive regression testing in the IQ Lab to validate its impact on IQ metrics and ensure it does not introduce regressions. This step extends the IQ Lab’s role to the final gatekeeper for OTA quality.
Canary Release: Release the update first to a small, risk-assessed test cohort and continuously monitor predefined safety, stability, IQ, and model-performance metrics. Only when the canary cohort meets release criteria and sufficient observational evidence has accumulated should the rollout proceed.
Staged Rollout: Gradually expand deployment according to product risk, cohort heterogeneity, statistical power, rollback capability, and operational impact. Each stage should include observation and review gates, with ongoing telemetry monitoring and retained authority to stop or roll back.
A/B Testing: During expansion, retain a control group to continuously compare performance between updated and control devices. This verifies effectiveness and quantifies the magnitude of performance changes attributable to the update.
Automatic Rollback Mechanism: During deployment, continuously monitor critical telemetry metrics (e.g., crash rate, AI inference failure rate, abnormal event trigger rate). If these exceed preset alarm thresholds, the system should automatically trigger a rollback to the previous stable version and immediately notify engineers for investigation.
5.3 Version Management and Multi-Generation Compatibility
As products iterate, the field may run multiple camera hardware versions (e.g., devices with different sensors or SoCs). The OTA system must support fine-grained version management to ensure each update package is only delivered to compatible hardware versions.
This challenge is especially pronounced for AI model updates. Devices with different hardware may have different NPU architectures and compute capacity; the same model may not run efficiently across all variants. Therefore, OTA systems typically maintain multiple model versions targeting different hardware and automatically select the appropriate version based on device Hardware ID.
Sustaining software support for older hardware requires ongoing engineering investment and becomes a technical-debt management challenge. Engineering teams must make strategic trade-offs between the cost of supporting legacy versions and the commercial risk of forcing customers to upgrade hardware.
6. Data-Driven Hardware Improvement Decisions
6.1 From Telemetry Signals to Design Inputs
The strategic value of in-field telemetry lies in driving hardware design improvements for the next generation. This requires engineers to extract design-relevant insights from statistical signals and to perform systematic trade-off analysis among performance gains, design-for-manufacturability (DFM), and cost.
The conversion path from telemetry to design improvements typically follows this logic:
- Quantify the scale and impact of the problem: determine the proportion of devices affected (breadth) and the severity of impact on system safety or performance (depth). These two dimensions together determine priority and return-on-investment for improvements.
- Build environment–failure association models: use correlation analysis to identify conditions associated with failures (e.g., certain temperature ranges, vibration frequencies, or usage durations) and convert them into testable failure hypotheses. This model is the starting point for design fixes and controlled verification; it does not replace root-cause confirmation.
- Design improvement options and evaluate trade-offs: for confirmed root causes, propose multiple potential fixes and evaluate each for performance improvement, cost increase, manufacturing complexity, and supply-chain impact.
- Verify improvements in the IQ Lab: before introducing changes to mass production, perform comprehensive IQ testing of prototypes in the IQ Lab to confirm the fix resolves the issue and does not introduce new degradations.
6.2 Typical Hardware Improvement Cases
Thermal Design Optimization: If telemetry shows frequent SoC thermal throttling in a fleet under high-temperature usage—causing increased AI-inference latency and concurrent optical IQ degradation—this can indicate heat conduction from the compute platform into the optical module. Improvements may include increasing the thermal-interface coverage area, optimizing metal housing heat paths, or introducing thermal isolation between compute and optical modules. These measures must be validated in the IQ Lab under the stress conditions and acceptable-drift envelopes defined by Article 5: Reliability Testing to ensure focus shift and other IQ metrics remain within design margins.
Sensor Upgrade Decisions: If telemetry indicates that pedestrian-detection recall at night for a specific camera model persistently lags daytime performance and the gap widens over comparative years of service, engineers should consider sensor aging, low-light IQ degradation, data-distribution shift, or model-adaptation insufficiency as candidate causes. Only after labeled-data model evaluation, IQ Lab measurements, and reliability evidence pinpoint the limiting factor should a sensor upgrade be specified for the next-generation product. The assessment must incorporate degradation rate, upgrade cost, supply-chain effects, and expected performance gains in a full Lifecycle Cost–Benefit Analysis.
Mechanical Structure Reinforcement: If telemetry shows that extrinsic-parameter drift rates are significantly higher in specific road conditions than in the comparison fleet, engineers should hypothesize high vibration, collision exposure, installation conditions, or assembly variance and perform geometric/mechanical verification. Fixes may include switching to AA adhesives with higher vibration resistance, increasing lens-bracket stiffness, or applying online dynamic calibration while the mechanical state remains within validated tolerances. Software compensation must not replace repairs for structural damage, ongoing displacement, or failed fasteners.
6.3 Field Verification of Improvement Effects
After hardware improvements enter production and are deployed, their real-world effects must be verified using telemetry. This verification is typically designed as a Controlled Experiment:
When deploying a new hardware version, retain a portion of the previous-version devices as a control group and track telemetry metrics for both cohorts. By comparing IQ performance time series for new and old versions under comparable environmental conditions, engineers can quantify the actual effect of the improvement and compare it to design-stage expectations.
If field validation shows the improvement falls short, engineers must reanalyze telemetry to identify causes (e.g., the fix has limited efficacy under certain environmental conditions) and design further improvements. This iterative “improve → deploy → verify → re-improve” loop is the core mechanism of closed-loop optimization.
7. Large-Scale Deployment Monitoring and Predictive Maintenance
7.1 Fleet-Level SPC Monitoring
In Article 4: Factory Testing & AA, Statistical Process Control (SPC) is used to monitor manufacturing stability and ensure each shipped camera meets quality standards. After deployment, SPC thinking is equally applicable to monitoring fleet health, although the application context and technical implementation differ.
Factory SPC monitors process stability (whether production is in control), whereas in-field SPC monitors the performance distribution of the deployed device population (whether the fleet is healthy). By building control charts from global fleet telemetry, engineers can track trends in key indicators (e.g., the fleet-average SFR estimate or the median AI inference confidence).
If a metric’s moving average drifts from the centerline or if consecutive out-of-control points appear, the system automatically triggers alerts to prompt investigation. This statistical monitoring can identify systemic performance degradation trends before they impact customer safety operations.
7.2 Predictive Maintenance Models
With long-term accumulated telemetry, engineers can build Predictive Maintenance Models to prioritize devices by degradation risk, maintenance priority, or service-window scheduling. Only when there is sufficient representative failure history, degradation trajectories, censoring information, maintenance records, and statistically validated predictive models is it appropriate to estimate Remaining Useful Life (RUL).
Such models can incorporate device age, cumulative thermal cycles, cumulative vibration exposure, trends in IQ-performance time series, and maintenance/operational records permitted by data governance. Outputs from survival-analysis or time-series models should be cross-validated, calibration-checked, and continuously monitored after deployment; they should support risk-ranked decisions by engineers or fleet managers rather than automatically replacing safety judgment.
Once sufficiently validated, shifting from Reactive Maintenance to risk-driven Predictive Maintenance helps identify devices that may need intervention earlier and improves maintenance planning and resource allocation. The benefits and safety impact should continue to be validated with product data.
7.3 Engineering Integration of User Feedback
In addition to automatically collected telemetry, User Feedback from fleet managers and drivers is an important information source. Issues reported by drivers in daily use (for example, “the camera’s night images are poor on a specific stretch of road” or “the AI alarm frequently false-triggers in a certain scenario”) often supply contextual information that telemetry cannot capture.
Engineering integration of user feedback into the telemetry analysis pipeline requires structured feedback collection mechanisms (e.g., a standardized problem-report interface in the fleet-management platform) and automatic correlation of feedback with the corresponding telemetry intervals. This “quantitative telemetry + qualitative user feedback” combination can substantially improve the efficiency and accuracy of RCA.
8. Engineering Challenges and Key Trade-offs
8.1 Data Privacy and Compliance
Fleet cameras may capture pedestrians on public roads, license plates of other vehicles, and driver faces. Data privacy and compliance are engineering constraints that must be prioritized when designing telemetry systems; processing personal data within the EU must also comply with applicable GDPR requirements for lawful processing, purpose limitation, and data-subject rights.
Data Minimization: The telemetry system should collect the minimum amount of data necessary to achieve analysis objectives. For analysis tasks that do not require uploading raw images (e.g., IQ drift tracking), lightweight statistical summaries should be used in preference to raw images.
Image Anonymization: For images that must be uploaded (e.g., event-triggered clips), edge-side face blurring and license-plate blurring should be applied to reduce exposure of directly identifiable visual information. These measures do not guarantee removal of all personal data or re-identification risk; location, timestamps, vehicle identifiers, audio, metadata, and unique contextual information may still constitute privacy risks and must be governed alongside data minimization, access controls, retention policies, and other applicable protections.
Geo-fencing: For markets with data localization, cross-border transfer restrictions, or stricter privacy regimes, the telemetry system may employ geo-fencing, local data processing, transmission restrictions, or other appropriate governance measures compliant with applicable law and data-protection impact assessments.
Encrypted Transmission and Storage: Telemetry data should use encryption in transit (e.g., TLS 1.3) and encryption at rest in cloud storage, along with authentication, access control, key management, and audit mechanisms. TLS 1.3 provides authentication, confidentiality, and integrity for channels between endpoints but is not equivalent to the complete system and key model required for end-to-end encryption.
8.2 Balancing Real-time Requirements and Cost
The design of a telemetry system must balance real-time requirements (engineers want to know about field issues as quickly as possible) against cost (frequent data uploads consume substantial bandwidth fees).
For safety-critical events (such as AI inference failures or system crashes), adopt near-real-time alerts and secure upload strategies based on risk level, connectivity capability, and data governance policies, so engineering teams can be informed within acceptable timeframes. For non-urgent analysis tasks such as tracking image quality (IQ) performance, use batch upload strategies; for example, upload aggregated statistics over Wi‑Fi when the vehicle is parked and has appropriate connectivity and operating mode, to reduce cellular bandwidth consumption.
8.3 Signal Quality of Telemetry Data
The signal quality of telemetry data is a key factor affecting the reliability of analysis results. The diversity of field environments means telemetry streams contain substantial noise; extracting meaningful signal from that noise is the core challenge in designing a telemetry system.
Design of sampling strategies: Pure random sampling can under-represent specific scenarios (for example, nighttime low-light conditions), reducing the representativeness of analysis. A stratified sampling strategy can set coverage targets for different time periods, geographic regions, and weather conditions to improve data representativeness and the robustness of trend interpretation.
Data quality filtering: Before performing IQ analysis, telemetry data must be filtered for quality to exclude low-quality samples caused by the scene itself (for example, extreme backlight or lens obstruction) so these samples do not contaminate statistical estimates of IQ performance.
Conclusion: Completing the Engineering Closed Loop
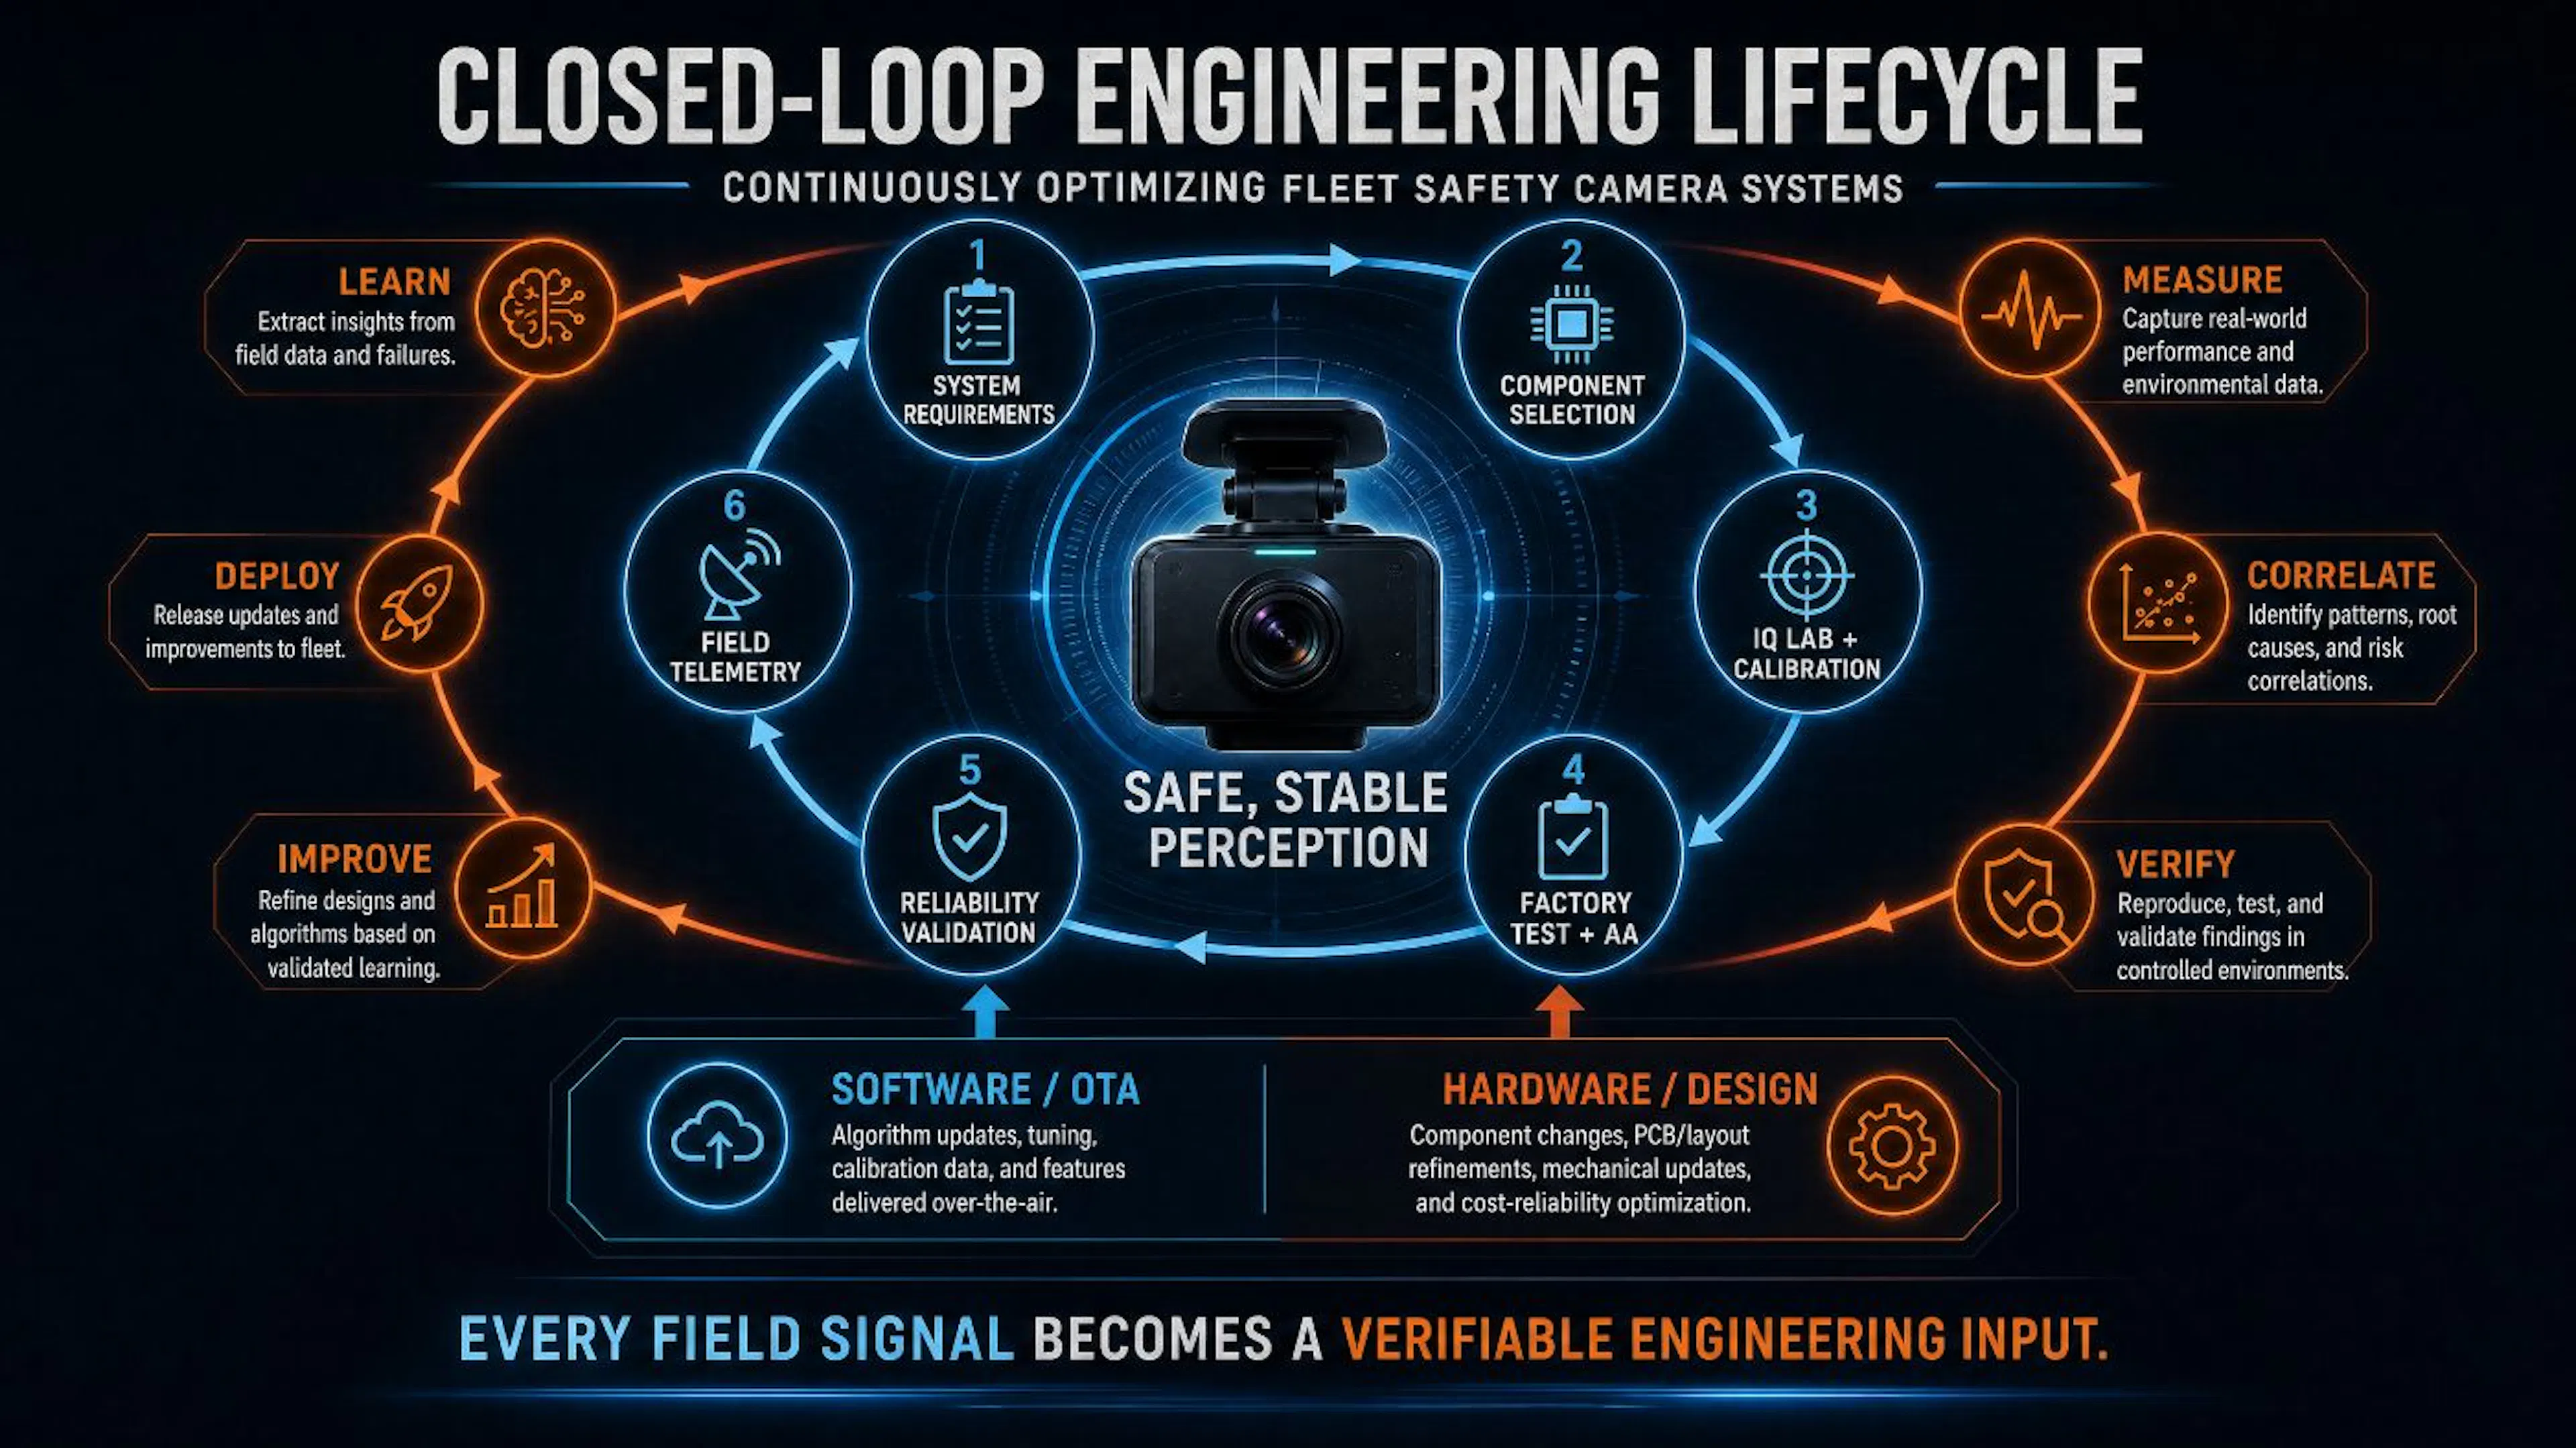 Figure 4: Cross–lifecycle engineering closed loop for a fleet safety camera system (series-level conceptual schematic). The diagram links system requirements and component selection, IQ Lab and geometric calibration, factory production validation, reliability testing, field telemetry, RCA, and OTA and hardware design improvements. Each element provides feedback to the others with verifiable evidence, rather than directly interpreting field correlations as failure conclusions.
From Article 1: Component Selection for component choices, to Article 2: Lab Build-up & Management for laboratory construction, through Article 3: Intrinsic & Extrinsic Calibration for geometric calibration, Article 4: Factory Testing & AA for production validation, and Article 5: Reliability Testing for durability testing, we have explored the complete technical chain of fleet safety camera system engineering from design to mass production. The field telemetry and closed-loop optimization discussed in this article are the final piece that links everything together and are the part of the systems engineering process that most clearly demonstrates engineering maturity.
A complete engineering closed loop is not just a closed loop of technical systems but a closed loop of engineering knowledge. Every field failure root-cause analysis (RCA) deepens engineers’ understanding of the system’s physical mechanisms; every successful OTA deployment validates the flexibility of the software architecture; every hardware improvement driven by telemetry turns field engineering insights into competitive advantages for the next-generation product.
In fleet safety applications, this closed loop matters far beyond the technology itself. When the telemetry system, through validated alerting, evaluation, and remediation processes, identifies risks that may affect model performance or equipment health early; when predictive-maintenance models support maintenance prioritization within scopes where they are applicable and sufficiently validated; and when every increment of accumulated field data can be turned into verifiable design and process improvements — that is the ultimate goal of fleet safety camera system engineering: to continuously improve system safety and reliability in real-world operation through ongoing engineering iteration.
Closed-loop optimization is not a finite, single project; it is an engineering discipline that continuously converts field experience into systematic improvements. Its purpose is not to assume that every product generation will necessarily be better than the previous one, but to use verifiable evidence to continuously improve product safety, reliability, and maintainability in real-world environments.
Disclaimer
The technical viewpoints, engineering methodologies, and practical recommendations presented in this article are the author’s independent analyses and opinions, synthesized from years of camera product development experience combined with publicly available information (including official websites, public product information, technical white papers, academic papers, industry standards, and public product specifications).
This article does not base technical claims on any particular company, product, or trademark. All case examples have been abstracted to illustrate common engineering issues faced by fleet safety camera systems and do not imply any cooperation, authorization, endorsement, sponsorship, or commercial relationship.
Unless otherwise noted, images used in this article are created by the author, AI-assisted, or reproduced from publicly available sources permitted for use; where third-party images or materials are cited, the source and original attribution are indicated appropriately.
The content of this article is for technical exchange and educational reference only and does not constitute engineering design, business decisions, or other professional advice. Because technology, product specifications, and industry best practices may change over time, readers should judge applicability based on their actual use cases.
如有侵权请联系:admin#unsafe.sh