NumPyImportimport numpy as npAPICreate arraynp.array([10, 11, 12, 13])# [10 11 12 13]np.array([ 2017-11-12 13:4:48 Author: bugs.cc(查看原文) 阅读量:1 收藏
NumPy
Import
import numpy as np
API
Create array
np.array([10, 11, 12, 13])
# [10 11 12 13]
np.array([10, 11, 12, 13, 14 ,15]).reshape([2,3])
# [
# [10 11 12]
# [13 14 15]
# ]
np.array([[1, 2], [3, 4]])
# [
# [1 2]
# [3 4]
# ]
np.arange(4)
# [0 1 2 3]
np.arange(2, 6)
# [2 3 4 5]
np.arange(4).reshape([2,2])
# [
# [0 1]
# [2 3]
# ]
np.random.random([2,3])
# [
# [ 0.00136044 0.46854718 0.59149907]
# [ 0.75636339 0.18204628 0.53191402]
# ]
Calculation
arr = np.array([10, 11, 12, 13, 14 ,15]).reshape([2,3])
# [
# [10 11 12]
# [13 14 15]
# ]
# sum
np.sum(arr, axis=0)
# [23 25 27]
np.sum(arr, axis=1)
# [33 42]
# minimum
np.min(arr, axis=0)
# [10 11 12]
np.min(arr, axis=1)
# [10 13]
# maximum
np.max(arr, axis=0)
# [13 14 15]
np.max(arr, axis=1)
# [12 15]
# index of the max/min value
np.argmin(arr)
# 0 (0 is the index)
np.argmax(arr)
# 5 (5 is the index)
# mean
arr.mean()
# np.mean(arr)
# 12.5
np.average(arr)
# 12.5
# cumulative sum
np.cumsum(arr)
# [10 21 33 46 60 75]
# differences between adjacent elements
np.diff(arr)
# [
# [1 1]
# [1 1]
# ]
# replace
np.clip(arr, 11, 14)
# [
# [11 11 12]
# [13 14 14]
# ]
# numbers below 11 become 11, numbers above 14 become 14, the rest stay unchanged
Indexing
arr = np.arange(3, 15).reshape([3,4])
# [
# [ 3 4 5 6]
# [ 7 8 9 10]
# [11 12 13 14]
# ]
arr[1, 1]
# arr[1][1]
# 8
arr[:, 1]
# [ 4 8 12]
arr[1, :]
# [ 7 8 9 10]
arr[1, 1:3]
# [8 9]
arr.flatten()
# [ 3 4 5 6 7 8 9 10 11 12 13 14]
for i in arr.flat:
print(i)
# prints each value. arr.flat is an iterator
Merge
A = np.array([1, 1, 1])
B = np.array([2, 2, 2])
np.vstack((A, B))
# [
# [1 1 1]
# [2 2 2]
# ]
np.hstack((A, B))
# [1 1 1 2 2 2]
Split
arr = np.arange(12).reshape([3,4])
# [
# [ 0 1 2 3]
# [ 4 5 6 7]
# [ 8 9 10 11]
# ]
np.split(arr, 2, axis=1)
# [array([
# [0, 1],
# [4, 5],
# [8, 9]
# ]),
# array([
# [ 2, 3],
# [ 6, 7],
# [10, 11]]
# )]
Pandas
Import
import pandas as pd
API
Create a DataFrame
pd.Series([1, 3, 6, np.nan, 44, 1])
# 0 1.0
# 1 3.0
# 2 6.0
# 3 NaN
# 4 44.0
# 5 1.0
# dtype: float64
pd.date_range('20171108', periods=6)
# DatetimeIndex(
# ['2017-11-08', '2017-11-09', '2017-11-10', '2017-11-11','2017-11-12', '2017-11-13'],
# dtype='datetime64[ns]',
# freq='D'
# )
dates = pd.date_range('20171108', periods=6)
pd.DataFrame(np.random.randn(6, 4), index=dates, columns=['a', 'b', 'c', 'd'])
# a b c d
# 2017-11-08 0.644350 1.122020 -1.263401 0.163371
# 2017-11-09 0.573329 -0.242054 -0.342220 1.070905
# 2017-11-10 0.714291 -0.721509 -2.298672 -0.513572
# 2017-11-11 -0.614927 2.010482 -1.369179 -0.901276
# 2017-11-12 0.709672 -0.430620 1.070244 -2.308874
# 2017-11-13 1.284080 1.169807 1.668942 0.859300
pd.DataFrame({
'A': 1.,
'B': pd.Timestamp('20171108'),
'C': pd.Series(1, index=list(range(4)), dtype='float32'),
'D': np.array([3] * 4, dtype='int32'),
'E': pd.Categorical(['test', 'train', 'test', 'train']),
'F': 'foo'
})
# A B C D E F
# 0 1.0 2017-11-08 1.0 3 test foo
# 1 1.0 2017-11-08 1.0 3 train foo
# 2 1.0 2017-11-08 1.0 3 test foo
# 3 1.0 2017-11-08 1.0 3 train foo
Selection
datas = pd.DataFrame({
'A': 1.,
'B': pd.Timestamp('20171108'),
'C': pd.Series(1, index=list(range(4)), dtype='float32'),
'D': np.array([3] * 4, dtype='int32'),
'E': pd.Categorical(['test', 'train', 'test', 'train']),
'F': 'foo'
})
# A B C D E F
# 0 1.0 2017-11-08 1.0 3 test foo
# 1 1.0 2017-11-08 1.0 3 train foo
# 2 1.0 2017-11-08 1.0 3 test foo
# 3 1.0 2017-11-08 1.0 3 train foo
datas.A
# datas['A']
# 0 1.0
# 1 1.0
# 2 1.0
# 3 1.0
# Name: A, dtype: float64
datas[0:3]
# A B C D E F
# 0 1.0 2017-11-08 1.0 3 test foo
# 1 1.0 2017-11-08 1.0 3 train foo
# 2 1.0 2017-11-08 1.0 3 test foo
datas.loc[0]
# when the index is something like '2017-11-8', use datas.loc['20171108']
# A 1
# B 2017-11-08 00:00:00
# C 1
# D 3
# E test
# F foo
# Name: 0, dtype: object
datas.loc[:,['A', 'B']]
# A B
# 0 1.0 2017-11-08
# 1 1.0 2017-11-08
# 2 1.0 2017-11-08
# 3 1.0 2017-11-08
datas.loc[[1, 3],['A', 'B']]
# A B
# 1 1.0 2017-11-08
# 3 1.0 2017-11-08
# icol selects by row number, col selects by index, ix is a mix of the two (either works)
# icol[1]
# ix[1]
# when the index is 2017-11-08, use ix['20171108']
datas[datas.E == 'test']
# A B C D E F
# 2017-11-08 1.0 2017-11-08 1.0 3 test foo
# 2017-11-10 1.0 2017-11-08 1.0 3 test foo
datas.index
# Int64Index([0, 1, 2, 3], dtype='int64')
datas.columns
# Index([u'A', u'B', u'C', u'D', u'E', u'F'], dtype='object')
datas.values
# array(
# [
# [1.0, Timestamp('2017-11-08 00:00:00'), 1.0, 3, 'test', 'foo'],
# [1.0, Timestamp('2017-11-08 00:00:00'), 1.0, 3, 'train', 'foo'],
# [1.0, Timestamp('2017-11-08 00:00:00'), 1.0, 3, 'test', 'foo'],
# [1.0, Timestamp('2017-11-08 00:00:00'), 1.0, 3, 'train', 'foo']
# ],
# dtype=object)
Sorting
datas.sort_index(axis=0, ascending=False)
# F E D C B A
# 0 foo test 3 1.0 2017-11-08 1.0
# 1 foo train 3 1.0 2017-11-08 1.0
# 2 foo test 3 1.0 2017-11-08 1.0
# 3 foo train 3 1.0 2017-11-08 1.0
datas.sort_index(axis=0, ascending=False)
# A B C D E F
# 3 1.0 2017-11-08 1.0 3 train foo
# 2 1.0 2017-11-08 1.0 3 test foo
# 1 1.0 2017-11-08 1.0 3 train foo
# 0 1.0 2017-11-08 1.0 3 test foo
datas.sort_values(by='E')
# A B C D E F
# 0 1.0 2017-11-08 1.0 3 test foo
# 2 1.0 2017-11-08 1.0 3 test foo
# 1 1.0 2017-11-08 1.0 3 train foo
# 3 1.0 2017-11-08 1.0 3 train foo
Set values
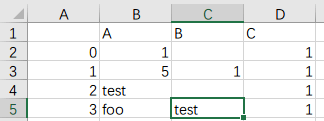
datas = pd.DataFrame({
'A': pd.Series([1, 5, 'test', 'foo'], index=list(range(4))),
'B': pd.Series([np.nan, 1, np.nan, 'test'], index=list(range(4))),
'C': pd.Series(1, index=list(range(4)), dtype='float32'),
})
# A B C
# 0 1 NaN 1.0
# 1 5 1 1.0
# 2 test NaN 1.0
# 3 foo test 1.0
datas.dropna(axis=0, how='any')
# when axis is 1, it checks the vertical direction for NaN values instead
# how = 'any' || 'all', the default is any
# with any, a row is dropped if it contains a single NaN.
# with all, a row is dropped only when every value in it is NaN
# A B C
# 1 5 1 1.0
# 3 foo test 1.0
datas.fillna(value=0)
# A B C
# 0 1 0 1.0
# 1 5 1 1.0
# 2 test 0 1.0
# 3 foo test 1.0
datas.isnull()
# A B C
# 0 False True False
# 1 False False False
# 2 False True False
# 3 False False False
# when the data is very large, or you only want to know whether any value is NaN
# np.any(datas.isnull()) == True
# returns True when any value is NaN
Import and export
pd.read_csv('***.csv',delimiter=',',encoding='utf-8',names=['test1','test2','test3'])
# arg 1: the target file to read
# arg 2: the delimiter of the csv file
# arg 3: the encoding
# arg 4: the column names
# test1 test2 test3
# 0 2017-11-18 ABC 51315.0
# 1 2017-11-19 DEF 5659.0
# 2 2017-11-20 GHI 1599.0
# 3 2017-11-21 JKL 2224.0
datas.to_csv('**.csv')
Merge
concat
datas1 = pd.DataFrame(np.ones((3, 4)) * 0, columns=['a', 'b', 'c', 'd'])
# a b c d
# 0 0.0 0.0 0.0 0.0
# 1 0.0 0.0 0.0 0.0
# 2 0.0 0.0 0.0 0.0
datas2 = pd.DataFrame(np.ones((3, 4)) * 1, columns=['a', 'b', 'c', 'd'])
# a b c d
# 0 1.0 1.0 1.0 1.0
# 1 1.0 1.0 1.0 1.0
# 2 1.0 1.0 1.0 1.0
datas3 = pd.DataFrame(np.ones((3, 4)) * 2, columns=['a', 'b', 'c', 'd'])
# a b c d
# 0 2.0 2.0 2.0 2.0
# 1 2.0 2.0 2.0 2.0
# 2 2.0 2.0 2.0 2.0
pd.concat([datas1, datas2, datas3], axis=0, ignore_index=True)
# a b c d
# 0 0.0 0.0 0.0 0.0
# 1 0.0 0.0 0.0 0.0
# 2 0.0 0.0 0.0 0.0
# 3 1.0 1.0 1.0 1.0
# 4 1.0 1.0 1.0 1.0
# 5 1.0 1.0 1.0 1.0
# 6 2.0 2.0 2.0 2.0
# 7 2.0 2.0 2.0 2.0
# 8 2.0 2.0 2.0 2.0
pd.concat([datas1, datas2, datas3], axis=1)
# a b c d a b c d a b c d
# 0 0.0 0.0 0.0 0.0 1.0 1.0 1.0 1.0 2.0 2.0 2.0 2.0
# 1 0.0 0.0 0.0 0.0 1.0 1.0 1.0 1.0 2.0 2.0 2.0 2.0
# 2 0.0 0.0 0.0 0.0 1.0 1.0 1.0 1.0 2.0 2.0 2.0 2.0
concat parameters
In concat, the default value of join is outer.
datas1 = pd.DataFrame(np.ones((3, 4)) * 0, columns=['a', 'b', 'c', 'd'], index=[1, 2, 3])
# a b c d
# 1 0.0 0.0 0.0 0.0
# 2 0.0 0.0 0.0 0.0
# 3 0.0 0.0 0.0 0.0
datas2 = pd.DataFrame(np.ones((3, 4)) * 1, columns=['b', 'c', 'd', 'e'], index=[2, 3, 4])
# b c d e
# 2 1.0 1.0 1.0 1.0
# 3 1.0 1.0 1.0 1.0
# 4 1.0 1.0 1.0 1.0
pd.concat([datas1, datas2], join='outer')
# a b c d e
# 1 0.0 0.0 0.0 0.0 NaN
# 2 0.0 0.0 0.0 0.0 NaN
# 3 0.0 0.0 0.0 0.0 NaN
# 2 NaN 1.0 1.0 1.0 1.0
# 3 NaN 1.0 1.0 1.0 1.0
# 4 NaN 1.0 1.0 1.0 1.0
pd.concat([datas1, datas2], join='inner')
# b c d
# 1 0.0 0.0 0.0
# 2 0.0 0.0 0.0
# 3 0.0 0.0 0.0
# 2 1.0 1.0 1.0
# 3 1.0 1.0 1.0
# 4 1.0 1.0 1.0
pd.concat([datas1, datas2], axis=1, join_axes=[datas2.index])
# a b c d b c d e
# 2 0.0 0.0 0.0 0.0 1.0 1.0 1.0 1.0
# 3 0.0 0.0 0.0 0.0 1.0 1.0 1.0 1.0
# 4 NaN NaN NaN NaN 1.0 1.0 1.0 1.0
# without join_axes:
# a b c d b c d e
# 1 0.0 0.0 0.0 0.0 NaN NaN NaN NaN
# 2 0.0 0.0 0.0 0.0 1.0 1.0 1.0 1.0
# 3 0.0 0.0 0.0 0.0 1.0 1.0 1.0 1.0
# 4 NaN NaN NaN NaN 1.0 1.0 1.0 1.0
append
datas1 = pd.DataFrame(np.ones((3, 4)) * 0, columns=['a', 'b', 'c', 'd'])
# a b c d
# 0 0.0 0.0 0.0 0.0
# 1 0.0 0.0 0.0 0.0
# 2 0.0 0.0 0.0 0.0
datas2 = pd.Series([1, 2, 3, 4], index=['a', 'b', 'c', 'd'])
# a 1
# b 2
# c 3
# d 4
# dtype: int64
datas1.append(datas2, ignore_index=True)
# a b c d
# 0 0.0 0.0 0.0 0.0
# 1 0.0 0.0 0.0 0.0
# 2 0.0 0.0 0.0 0.0
# 3 1.0 2.0 3.0 4.0
merge
left = pd.DataFrame({
'key': ['k0', 'k1', 'k2', 'k3'],
'A': ['A0', 'A1', 'A2', 'A3'],
'B': ['B0', 'B1', 'B2', 'B3']
})
# A B key
# 0 A0 B0 k0
# 1 A1 B1 k1
# 2 A2 B2 k2
# 3 A3 B3 k3
right = pd.DataFrame({
'key': ['k0', 'k1', 'k2', 'k3'],
'C': ['C0', 'C1', 'C2', 'C3'],
'D': ['D0', 'D1', 'D2', 'D3']
})
# C D key
# 0 C0 D0 k0
# 1 C1 D1 k1
# 2 C2 D2 k2
# 3 C3 D3 k3
pd.merge(left, right, on='key')
# A B key C D
# 0 A0 B0 k0 C0 D0
# 1 A1 B1 k1 C1 D1
# 2 A2 B2 k2 C2 D2
# 3 A3 B3 k3 C3 D3
left = pd.DataFrame({
'key1': ['k0', 'k0', 'k1', 'k2'],
'key2': ['k0', 'k1', 'k0', 'k1'],
'A': ['A0', 'A1', 'A2', 'A3'],
'B': ['B0', 'B1', 'B2', 'B3']
})
# A B key1 key2
# 0 A0 B0 k0 k0
# 1 A1 B1 k0 k1
# 2 A2 B2 k1 k0
# 3 A3 B3 k2 k1
right = pd.DataFrame({
'key1': ['k0', 'k1', 'k1', 'k2'],
'key2': ['k0', 'k0', 'k0', 'k0'],
'C': ['C0', 'C1', 'C2', 'C3'],
'D': ['D0', 'D1', 'D2', 'D3']
})
# C D key1 key2
# 0 C0 D0 k0 k0
# 1 C1 D1 k1 k0
# 2 C2 D2 k1 k0
# 3 C3 D3 k2 k0
pd.merge(left, right, on=['key1', 'key2'], how='inner')
# how defaults to inner
# A B key1 key2 C D
# 0 A0 B0 k0 k0 C0 D0
# 1 A2 B2 k1 k0 C1 D1
# 2 A2 B2 k1 k0 C2 D2
pd.merge(left, right, on=['key1', 'key2'], how='outer')
# A B key1 key2 C D
# 0 A0 B0 k0 k0 C0 D0
# 1 A1 B1 k0 k1 NaN NaN
# 2 A2 B2 k1 k0 C1 D1
# 3 A2 B2 k1 k0 C2 D2
# 4 A3 B3 k2 k1 NaN NaN
# 5 NaN NaN k2 k0 C3 D3
pd.merge(left, right, on=['key1', 'key2']. how='right')
# A B key1 key2 C D
# 0 A0 B0 k0 k0 C0 D0
# 1 A2 B2 k1 k0 C1 D1
# 2 A2 B2 k1 k0 C2 D2
# 3 NaN NaN k2 k0 C3 D3
pd.merge(left, right, on=['key1', 'key2'], how='left')
# A B key1 key2 C D
# 0 A0 B0 k0 k0 C0 D0
# 1 A1 B1 k0 k1 NaN NaN
# 2 A2 B2 k1 k0 C1 D1
# 3 A2 B2 k1 k0 C2 D2
# 4 A3 B3 k2 k1 NaN NaN
Matplotlib
Import
import matplotlib.pyplot as plt
API
plot
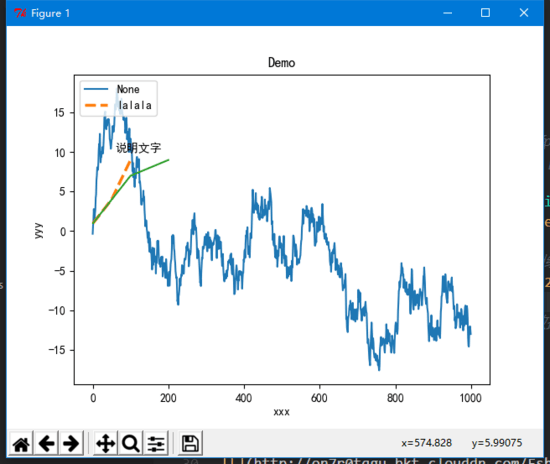
data = pd.Series(np.random.randn(1000)) # 1000 random numbers
data = data.cumsum() # cumulative sum
# since a pandas object is data already, it can be plotted directly,
# two other forms: plt.plot(x=, y=) or plt.plot([xxx, xxx], [yyy, yyy])
data.plot()
plt.rcParams['font.sans-serif']=['SimHei'] # make Chinese labels render correctly
plt.rcParams['axes.unicode_minus']=False # make minus signs render correctly
# linewidth: the width of the line
# linestyle: the line style (- solid, -- dashed, -. dash-dot, : dotted, None draws nothing)
plt.plot([1,50,100],[1,4,9], linewidth=2.5, linestyle='--', label='lalala')
plt.legend(loc='upper left') # without this line, the label above will not show
plt.plot([1,100,200],[1,7,9]) # a third data series
plt.title('Demo') # title
plt.xlabel('xxx') # x-axis name
plt.ylabel('yyy') # y-axis name
plt.text(60, 10, u'annotation') # annotation text
plt.show() # display
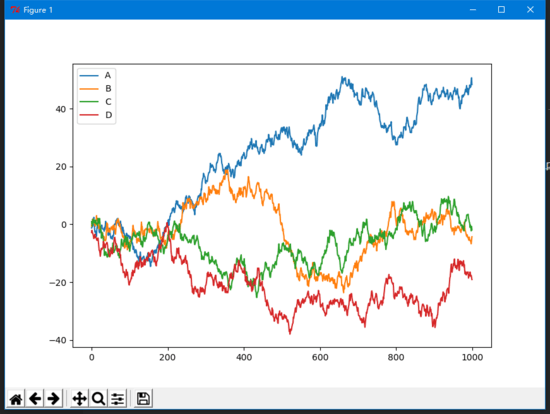
# random numbers with 1000 rows and 4 columns, rows numbered 0 to 999, columns A B C D
data = pd.DataFrame(np.random.randn(1000, 4),
index=np.arange(1000),
columns=list('ABCD'))
data = data.cumsum() # cumulative sum
data.plot()
plt.show()
Other charts
Bar chart
plt.bar(left, height, width=0.8)
Scatter plot
如有侵权请联系:admin#unsafe.sh