- A Cisco Talos researcher worked around the limitations of hardware-level Code Read-out Protection (RDP) on the Socomec DIRIS M-70 gateway by pivoting from physical debugging to a "good enough" emulation approach.
- By focusing on emulating only the single thread responsible for Modbus protocol handling rather than the entire system, the author demonstrates how a streamlined emulation strategy can effectively surface vulnerabilities in complex industrial Internet of Things (IoT) devices.
- The post highlights the integration of the Unicorn Engine and AFL for coverage-guided fuzzing, as well as the use of the Qiling framework to visualize code coverage and perform root cause analysis on crashes.
- This research led to the discovery of six CVEs related to denial-of-service vulnerabilities, all of which have been patched by the manufacturer through Cisco’s Coordinated Disclosure Policy.
This blog describes efforts at emulating functionality of the Socomec DIRIS M-70 gateway to discover vulnerabilities. In vulnerability research, knowing which tool to use for the job at hand is crucial. This post will highlight multiple emulation tools and approaches used, detail the benefits and drawbacks of each, and reveal how a "good enough" approach can really pay off.
Project background
The M-70 gateway facilitates data communication over both RS485 and Ethernet networks, supporting a wide array of industrial communication protocols, including Modbus RTU, Modbus TCP, BACnet IP, and SNMP (v1, v2, and v3). This gateway is vital for energy management in sectors like critical infrastructure, data centers, healthcare, and the general energy sector. However, as an industrial Internet-of-Things (IIoT) device, vulnerabilities in the M-70 or similar gateways can lead to severe consequences, including operational disruption, financial losses, and manipulation of industrial processes. These risks are severe, especially in critical infrastructure where a compromised gateway could lead to widespread outages or equipment damage.
This large attack surface, the impact of vulnerabilities, and the fact that the M-70 gateway runs the real-time operating system (RTOS) µC/OS-III, made it an attractive research target. There was an expectation that prior familiarity with this RTOS, gained through previous work, would offer an advantage in understanding the device’s intricacies.
Why emulate? The debugging roadblock
Having insight into the system is critical to performing root cause analysis of any discovered vulnerabilities. Ideally, one would have real hardware and the ability to debug the software running on that hardware. The presence of an unpopulated JTAG header on the board was an exciting initial find.

However, the presence of a JTAG header does not always guarantee debug access. There are a variety of reasons for this, but in the case of the M-70 gateway, code read-out protection (RDP) Level 1 is enabled. This is a feature of STM32 microcontrollers, which provides flash memory protection. There are three possible levels (0 – 2) of this protection. Level 1 prevents flash memory reads while debugger access is detected (e.g., JTAG). When attached via JTAG, no access to Flash memory is permitted, essentially preventing debugging of the running software. The intention behind this protection is to prevent third parties (like myself) from dumping the contents of flash via JTAG.
This was bad news. It was not possible to step through the code processing malicious network messages to determine the cause of device disruption. The address for the $pc register (see Figure 2) indicates that the MCU has entered a core lock-up state.

In this project, two significant opportunities arose regarding code and memory access. First, an unencrypted firmware update file was available, providing the code that would be written to flash and eliminating the need to read it directly from memory. The second is that the ability to access SRAM while a debugger is attached is allowed with RDP Level 1 enabled (see Figure 2). This made it feasible to dump the contents of SRAM during the device’s execution and capture a snapshot of dynamic data.

While it was not possible to have fine-grained control over the processor’s state when dumping the SRAM contents, some influence could be exerted (e.g., opening a TCP connection with the device before dumping the SRAM contents). The objects and data created as a result of this connection would be present when the CPU was halted for the SRAM dump.
Emulating with Unicorn
Emulation is one solution to this inability to debug the software natively. If the processing code of interest can be emulated, it is possible to gain visibility into the effects of a malicious message on the state of the M-70. When emulating software, it’simportant to recognize that the emulated code might not behave exactly like it would on the physical device. Full system emulation aims to mitigate this by mimicking device behavior as closely as possible, but it requires deep knowledge of system internals and significant development to accurately emulate peripherals. The focus for this project was on vulnerabilities within the Modbus protocol handling code, which ran in a single thread of the M-70 application. Rather than spending the time required for full system emulation, the decision was made to emulate only the Modbus thread. Admittedly, emulating this single thread would not be true to the device’s real-world operation. However, this deliberate time trade-off was made with the hope that it would still be “good enough” to find vulnerabilities in the Modbus protocol handling code.
The first step in this process involved utilizing the Unicorn Engine, a powerful CPU emulation framework supporting various architectures. It provided the core capability to run the Modbus thread’s code in a controlled software environment where I could then inspect the system state when processing network data.
The emulator was implemented with an entry point in the Modbus processing thread, positioned after network data had been received. Before emulating this code, the argument registers $r2 and $r3 which originally contained a pointer to network data and its length were modified to reference data originating from the emulator, along with it’s corresponding length. Once the argument registers were updated, emulation could begin and continue until that thread returned from the message processing function.
The need to fuzz
Manual inspection of network processing code is sometimes sufficient; however, this Modbus thread supports over 700 unique message types, defined by supported register values and something referred to as service identifier. The combination of these two values within a Modbus message influenced the code path of data processing, and with so many code paths to investigate, automation was clearly necessary.

Unicorn’s AFL integration made it simple to fuzz using the emulator, automatically exploring these many execution paths. AFL uses coverage-guided test case generation to maximize the number of different code paths explored. This is tool provided precisely the type of automation that was necessary. It was simple integrating AFL fuzzing into the Unicorn script, requiring only the addition of the place_input_callback function and a call to unicorn_afl_fuzz (see Figure 5).

Triage and debugging
With fuzzing came crashes, and the next step was to triage those crashes to perform root cause analysis. Typically, a debugger would be the go-to tool for this job; however, because execution was performed through emulation, GDB didn’t "just work" out of the box. A tool compatible with the Unicorn framework’s internal CPU representation was required. Conveniently, a tool called udbserver does exactly that. Udbserver is a plugin for the Unicorn engine that enables debugging of Unicorn emulated code within GDB. This tool worked as advertised and allowed remote GDB connections to the emulated code. There is only one line required to add udbserver support to a unicorn emulator: udbserver.udbserver(mu,1234,0x80fede0)beforecalling emu_start.
Qiling framework: Adding code coverage to the mix
Observing code coverage visually is another important part of any fuzzing campaign. It helps identify unexplored paths and provides insights for root cause analysis by comparing coverage between test cases. The need for this feature prompted an investigation into the Qiling framework. Described as a full system emulator, it also supports debugging and code coverage output. Could Qiling to emulate only a single thread rather than the whole system? It would be wonderful to benefit from its features without having to spend the time to implement full system emulation.
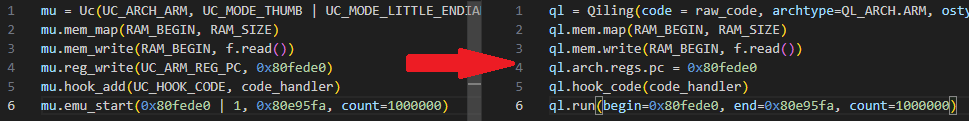
The Qiling framework is based on Unicorn, so it was likely that the Unicorn script could be easily ported to Qiling. Figure 6 shows the API changes between unicorn engine and the Qiling framework.

It wasn’t clear from existing examples in the Qiling codebase if single thread emulation was possible. After some investigation and some small modifications to two components called the blob loader and the blob OS it became feasible to emulate just this single thread rather than the whole system. Those code changes have been integrated into the development branch of Qiling on GitHub. Also, a little bit of monkey patching was also required for my emulation script in order to output the coverage data in the correct way so that it contains accurate metadata for use in visualization tools like bncov or Lighthouse. You can see an example of this in action in the Qiling repository.
This code coverage feature turned out to be more useful than originally expected. Code coverage data from multiple test inputs was compared to identify points at which their execution paths diverged. This approach facilitated rapid identification of the root causes of the crashes generated by AFL.

Vulnerability highlight
This fuzzing campaign led to the discovery of multiple Modbus messages that would cause a denial of service within the device and resulted in six CVEs. You can read those vulnerability reports here: TALOS-2025-2248 (CVE-2025-54848 – CVE-2025-54851), TALOS-2025-2251 (CVE-2025-55221, CVE-2025-55222).
All the discussed vulnerabilities have been reported to the manufacturers in accordance with Cisco’s Coordinated Disclosure Policy. Each of these vulnerabilities in the affected products has been patched by the corresponding manufacturer.
For SNORT® coverage that can detect the exploitation of these vulnerabilities, download the latest rulesets from Snort.org.
Conclusion
In the future, Qiling will be my go-to for from the start of an emulation project. The high-level features of debugging and code coverage really make this a stand-out tool. However, if all you need is the ability to debug your scripts, udbserver is an easy solution that you can use with your Unicorn scripts as-is. Remember, "good enough" emulation is sometimes all that is needed to achieve impactful vulnerability discovery.