好的,我现在需要帮用户总结一篇关于恶意软件分析的文章,控制在100字以内。首先,我得通读整篇文章,抓住主要内容和关键点。 文章主要讨论了恶意软件分析如何支持威胁情报,特别是通过爬升“疼痛金字塔”来提升检测能力。作者以Lumma Stealer为例,分析了其C2基础设施和样本数据。研究发现,C2域名的平均使用时间很短,通常不到一个月,这表明及时检测和响应的重要性。 此外,文章提到通过分析TLS证书和JARM指纹等高级指标,可以更有效地识别和阻止恶意活动。这些方法帮助安全团队从简单的哈希值转向更复杂的基础设施指标,从而提高检测效率。 总结时,我需要涵盖以下几点:恶意软件分析的作用、Lumma Stealer的研究、C2域名的短暂生命周期、以及提升检测能力的方法。同时,要确保语言简洁明了,控制在100字以内。 现在把这些要点整合成一段流畅的文字:文章探讨了恶意软件分析如何支持威胁情报,并通过爬升“疼痛金字塔”提升检测能力。以Lumma Stealer为例,研究发现其C2域名平均使用时间不到一个月,强调了及时检测的重要性。通过分析TLS证书和JARM指纹等高级指标,安全团队可以更有效地识别和阻止恶意活动。 </think> 文章探讨了恶意软件分析如何支持威胁情报,并通过爬升“疼痛金字塔”提升检测能力。以Lumma Stealer为例,研究发现其C2域名平均使用时间不到一个月,强调了及时检测的重要性。通过分析TLS证书和JARM指纹等高级指标,安全团队可以更有效地识别和阻止恶意活动。 2026-2-5 11:25:22 Author: www.vmray.com(查看原文) 阅读量:3 收藏
Introduction
In this blogpost, we will discuss how malware analysis supports threat intelligence, specifically by climbing the Pyramid of Pain. To this end we will take a deep dive into Lumma Stealer samples and Command-and-Control (C2) infrastructure. We will provide insights into the C2 domain lifecycle for Lumma, as well as learnings from our quantitative analysis. At VMRay, we use hypervisor-based sandboxing technology to process and analyze a large number of malware samples to identify malware capabilities and behaviour, as well as classification and family attribution. Malware analysis helps us to extract indicators of compromise and artifacts, which then helps us to climb the Pyramid of Pain.
Background and methodology
Lumma Stealer is a a Malware-as-a-Service (MaaS) information stealer which has been around since 2022, but has seen a sharp decline in the second half of 2025 due to law enforcement activities [1] and doxxing of alleged Lumma Stealer operators [2]. Lumma Stealer has been successfully deployed by threat actors through various attack vectors, including malvertising and pastejacking with the goal of stealing credentials and sensitive information like browser data. This malware family has dominated the infostealer market for years. The data in this blogpost is based on extracted configurations from more than 7000 Lumma Stealer samples collected between July 2025 and October 2025.
In Cyber Threat Intelligence (CTI), we often use the Pyramid of Pain (see Figure 1) when talking about indicators. The Pyramid of Pain [3] describes how much pain defenders can cause an attacker by denying (through detection or mitigation) specific indicators. At the bottom of the pyramid we have hash values – which are trivial for an attacker to change – whereas at the top we have TTPs (tactics, techniques and procedures) which usually will require an attacker to invest time to change their strategy and tooling.

In this post, the concept is used to demonstrate how malware analysis helps us moving up the Pyramid of Pain, but also how climbing the pyramid significantly lowers the number of indicators to monitor and how it helps to improve detection.
For this research, we collected more than 7000 Lumma Stealer malware samples between July 2025 and October 2025, as well as their corresponding extracted C2 domains. For every C2 domain, we then collected several data points:
- t0: Domains first seen (either registration date or certificate generation date, depending on what is available and which is earlier)
- t1: Domain first used (the timestamp of the earliest sample in the dataset where this domain was found in the config)
- t2: Domain last used (the timestamp of the most recent sample in the dataset where this domain was found in the config)
- Sightings: How often a domain is used in a sample configuration
- The SHA256 hash of the earliest sample with this C2 domain
- The SHA256 hash of the most recent sample with this C2 domain
- The JARM hash of the C2 server
- The certificate issuer for the C2 server certificate
But we also need to acknowledge the weaknesses and limitations of the dataset used here. As mentioned earlier, the samples were collected in a four months timespan, leaving some visibility gaps. The domains in our set might have been used earlier already, or even later. Additionally, there is no way to ensure completeness for collected malware samples. There is certainly a large number of samples from the same time-frame which were not collected and analysed here due to not being present in our data lake, and we have no way to estimate the number of unreported samples. Nevertheless, we believe that the data gathered for this analysis still provides some forward-looking insights into the indicator lifecycle, and highlights how malware analysis helps improving detection capabilities by climbing the Pyramid of Pain.
Analysis and results
The first significant result in the dataset is the number of unique C2 domains used in our Lumma Stealer sampleset. Those more than 7000 unique samples used 1207 unique C2 domains in their configuration. When putting these results next to the Pyramid of Pain, we have not only elevated our indicators to a point where they are more difficult for a threat actor to change, but we have also reached a point where fewer indicators cover the same set of malware samples. A blocked hash means the threat actor can flip a single bit in the sample and avoid detection, a blocked domain means they need to make the effort of registering a domain, create a certificate, and use the domain in their malware configuration. Using malware analysis and configuration extraction here helps us to pivot from 7000 indicators that can trivially be bypassed to around 1200 indicators which are much more difficult to replace for the threat actors.
When discussing the lifecycle of indicators, threat intelligence teams often also face the question: “How long is an indicator valid?”. For hashes, there is an easy answer: forever (even though the usefulness of the indicator will certainly decline). For domains, that question is much more difficult to answer as it depends on how threat actors deploy and use their infrastructure. Nevertheless, our dataset gives some insights and answers for Lumma Stealer.
Out of the 1200 C2 domains in our dataset, the median for domain sightings in samples is three, meaning a domain can be found in three different samples. Looking at the average gives a very different picture with 51.98 sightings. This is caused by domains which have been used in thousands of malware samples. The most prevalent domain can be found in around 3700 samples, with several other domains also with more than 1000 sightings. Out of the 1200 domains, eight can be found in more than 1000 samples, and 116 can be found in more than 100 samples. This shows that a relatively small number of domains are being repeatedly reused, whereas the majority of domains is only used in few samples. It is not fully clear why certain domains are being reused significantly more by the threat actors than others, but Lumma Stealer being sold in a MaaS model means that the family is used by different operators, which might have different procedures for infrastructure usage. Follow-up research including also the campaign-id might shed more insights into this.
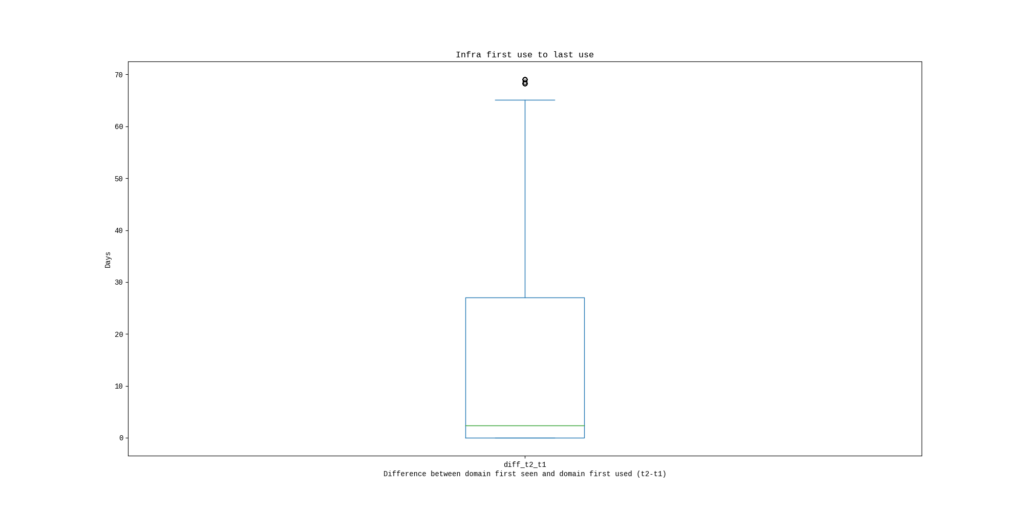
Next, we can look at the lifecycle of the domains themselves by checking the delta between t0 (domain first seen) and t1 (domain first used in a sample), as well as delta between t1 and t2 (domain last used in a sample). The median difference between domain first seen and domain first used is 67 days, so around two months. But the more interesting value is the difference between domain first used and domain last used. Here the median value is 2.33 days, with the average being 15.22 days. This data is highly influenced by the domains that are only seen in a single sample, but even considering the 75th percentile the value is below 30 days (27.01).
I figures 2.1 and 2.2, we can see the visualization of the time difference between domain first seen and domain first used (t1-t0).

showing median, quartiles Q1 and Q3, as well as outliers

Figures 3.1 and 3.2 show how long domains are used within malware samples from our dataset (t2-t1). From the data we can see that around one third of the domains can only be found once in our malware samples, which causes the difference between first seen and last seen to be 0. This leads to a significant spike in the plot and impacts the percentiles as well as average value.

showing median, quartiles Q1 and Q3, as well as outliers

The relationship between sightings and usage duration can also be seen in figure 4, where it again becomes very clear that the large majority of domains in our dataset is only used very few times.

If we ignore the domains with exactly 1 sighting, the plot changes slightly, as we can see in figures 5.1 and 5.2. Nevertheless, the median usage duration of a domain is still below three weeks, and the 75th percentile is still below 50 days.

showing median, quartiles Q1 and Q3, as well as outliers

Lastly, the collected data can be used to move up even higher in the Pyramid of Pain via TLS certificates and host fingerprinting using JARM. In figures 6.1 and 6.2 we can observe that the C2 infrastructure, 1200 domains for those 7000 samples, clearly follows patterns how the threat actors generate TLS certificates (based on the issuer) and how they set up their infrastructure (based on JARM fingerprint).
Especially looking at the JARM fingerprints, we can see that five of them dominate the C2 infrastructure for Lumma Stealer. It becomes evident that based on this information it is possible to hunt and potentially find C2 infrastructure before it is even actively used for C2. Detecting and denying actor infrastructure early forces threat actors to change their procedures and setup, making it annoying or more difficult for them (note: neither certificate issuer nor JARM hash alone are high fidelity indicators).


Results
One of the major learnings from this dataset can be summarised as “speed is key“. Once an indicator is observed in a malware campaign, it has a very short lifespan. The vast majority of domains in our dataset were used as a C2 for less than a month in malware configurations. Ingesting an indicator into detection infrastructure weeks or months later could very likely mean that it provides no value for real-time detection (but might still be useful for retroactive detection). This highlights the importance of a properly aligned CTI collection plan: What needs to be collected, where does it come from, how timely it is collected, and how it will be used. Evaluating collection sources for timeliness and indicator quality is important to not waste processing capacity on irrelevant or outdated indicators.
Second, we can also see from the data that malware analysis and moving up the Pyramid of Pain can support detection efforts with new indicators and great benefits: Additional indicators can be used to supplement detection and detect previously unknown, and potentially undetected samples. Especially pivoting from samples and hashes towards C2 infrastructure – which is commonly reused by threat actors – can significantly improve detection coverage. The more a piece of C2 infrastructure is used by threat actors, the more impactful this indicator becomes for defenders.
Example VMRay Lumma analysis reports
- https://www.vmray.com/analyses/_tf/520aeb92e5f5/report/overview.html
- https://www.vmray.com/analyses/_tf/2adcd7853089/report/overview.html
References
如有侵权请联系:admin#unsafe.sh