
I looked into a CONTEXT and found a TRAP
Intro
You can check this project out on GitHub, and specifically you can see veh_monitor.rs which houses the code discussed in this blog post.
I have published a blog post previously from the offensive engineering perspective, of using CrowdStrike’s research to use Vectored Exception Handling Squared, which has now made it into in my own Red Team Post Exploitation Framework Wyrm.
As a very brief summary and primer to this topic, Vectored Exception Handlers are a Windows feature which allow a developer to set handlers (or ‘callbacks’) when an exception occurs. Then there are the hardware breakpoints that can be set via Vectored Exception Handling, which are handled by the CPU when the instruction pointer points to an address in one of the debug registers.
A malware developer (or Red Teamer ^^) can use these hardware breakpoints to effectively cause the complete bypass of a routine from dispatching if the address in one of the debug registers is one which the developer wishes to avoid being dispatched. For more context (on VEH Squared), see my blog post and POC for it. I would recommend having a solid grip on VEH before reading on.
The advantage of using VEH Squared is that you do not have to rely on the SetThreadContext API which can easily be hooked by
an EDR in userland.
As I love winternals, and ultimately wish to contribute to the security community to help defeat threat actors, I wanted naturally to find some detection surface for this technique. I am developing an experimental EDR, Sanctum, for fun and to help me learn the deeper internals which aren’t necessarily served on a plate in a course. For anybody else on this journey of deep winternals knowledge, from either the offensive or defensive side of the house, I would highly recommend doing this yourself!
This post is designed to show my research, some problems I encountered, and the result - Sanctum does detect VEH^2 abuse! As a bottom line up front, this is what the mechanism looks like:

Caveats and assumptions
Before continuing, I wanted to caveat this with the following:
- It is the use of hardware debug registers we concern ourselves with in this research which enables VEH Squared.
- Undocumented / unexported functions: The strategy I have used relies upon several unexported and undocumented functions. If anybody from Microsoft is reading this, I do not see a huge reason as to why the functions used here are required to be unexported. If the threat model is to stop rootkits / cheats from using them, then, that fails as an assumption as rootkits can (as I have) obtain the routine address through pattern matching.
- Only Dr0 is demonstrated: The research published here is only concerning itself with the Dr0 debug register. You can simply expand this by looking up the other debug registers as well as Dr0.
- The testing was performed in a Windows 11, 25H2 VM with debug mode OFF - this is important as setting exceptions on the debug registers causes the VM to freeze up when debug mode is on (so you cannot attach a kernel debugger when testing this, stick with DebugView to view messages from the driver).
As this research uses undocumented functions (at least, undocumented to the public) - EDR vendors may choose not to use them due to the concerns over stability and the applicability to systems en-mass, across different versions of Windows, kernel builds, etc. Alas, it is still fun research.
Technical problems
Inline driver injection
The first port of call was to research exactly how an exception SINGLE_STEP is dispatched once the debug register == rip. I started here assuming the exception has some handler we can hook into from the driver. I don’t think this is the case from what I have read / looked at.
The obvious place to start would be looking at KiExceptionDispatch in ntoskrnl.exe, to see how exceptions are handled, and whether we can
somehow hook into an alternate handler mechanism, or overwrite some kernel internal structures. This cascades into a somewhat complex
tree, and I couldn’t spot anything obvious. That’s not to say there isn’t a mechanism hidden there, but I did not want to waste a lot of time
looking, when I already have a nicer solution in mind.
HOWEVER - in usermode, before the exception
is dispatched, KiUserExceptionDispatcher in ntdll.dll is executed. Maurice
wrote a great blog post on this function and
there is an archived Microsoft article on this.
This undocumented ntdll routine seems to have the below signature:
KiUserExceptionDispatcher( PEXCEPTION_RECORD pExcptRec, CONTEXT * pContext )
So, from an EDR perspective, when loading your DLL, you can consider overwriting this function to jump to your routine, inspect the CONTEXT record, look at the debug registers, etc. However, if an adversary causes your DLL to not load, misbehave, remap ntdll etc, then that detection surface is scrubbed.
I would hedge my bets the signature of the KiUserExceptionDispatcher is unlikely (not impossible..) to change between builds given it is
so integral to the operating system - and lets face it, the exception handlers are deeply stable due to their legacy.
Although it seems controversial (by some) for EDR’s to operate in the kernel, this is ultimately the best place for a lot of the detection logic where applicable. And now we can write drivers in Rust, I say, bring it on!! I have chosen to stay in kernel mode for this research as it is more interesting to me, and ultimately I do believe this could be a strong mechanism for security vendors. I may have a go at hooking this function from my userland EDR DLL for a subsequent blog post.
Events Tracing for Windows
Turning my attention to the specific attack surface of VEH Squared, I reversed NtContinueEx in ntoskrnl.exe which is dispatched at the
end of an exception handled by a VEH. To quote CrowdStrike:
This is because, triggered by KiUserExceptionDispatcher exported by NTDLL, on resuming from the exception handled by a VEH (after the execution of the function RtlDispatchException, which calls RtlpCallVectoredExceptionHandlers), the thread will call the NtContinue function (used to set a new CONTEXT after processing exception for the executing thread) by specifying the CONTEXT managed by the Exception Handler.
I cannot see any Events Tracing for Windows being emitted (at least in NtContinueEx) that could be helpful for an EDR. @Microsoft maybe if a Dr0
register is enabled an ETW:TI signal could be emitted and it would then be for the security vendor to tune when they ingest the telemetry.
My strategy
As stated, I want to keep my detection surface in the kernel. Every thread which runs on the operating system is run under the thread scheduler, which restores the thread’s CPU registers from state saved on the thread’s kernel stack.
When the thread stops executing, the CPU and kernel saves the threads register state in a _KTRAP_FRAME on the kernels stack, which is pointed to from the __KTHREAD object (which is the kernels representation of a thread).
The thread is therefore said to have its own Context, which is the set of register values, being a CONTEXT structure. When you hear people talking about context switching overhead in terms of multi-threaded programming, this is what that refers to at the low level.
When execution on the CPU is resumed, the _KTRAP_FRAME is loaded back into the CPU from the existing kernel memory.
This gives us a nice surface to detect the register state from kernelmode. Given VEH Squared abuse by malware relies upon the debug registers on the CPU, we can directly read these.
There is no place for malware to hide the fact it has altered the debug registers, because we have direct access to them.
Reaching into the Context
So, with this in mind - if we can read the threads CPU state, then we can check the debug register values, and see if they point to some memory that we wish to protect from VEH Squared abuse.
My approach therefore is to write a module for my EDR driver which:
- Enumerates all threads running in usermode processes
- For each thread:
- Obtain a view into the CPU state via a CONTEXT structure
- If a debug register != 0 then ask ourselves:
- Is the image that the address from the debug register lives in one which we outright want to ban? -> SIEM alert
- Is the address the exact address of one we want to ban? -> SIEM alert
- Else: -> Allow
- Else: -> Allow
For example: we may wish to outright ban any debug register address in amsi.dll (which translates to the above list point 2.2.1), or, we may wish to ban in the case where the debug register address is the address of NtTraceEvent.
Visually:
Coding
So, with this strategy in mind lets build it! I started off by trying to use the undocumented but exported function, PsGetContextThread.
I spent a while trying all sorts to make this work, but it failed several times over and drove me to madness.
I came across a post on unknowncheats
where someone was also getting STATUS_UNSUCCESSFUL from calling PsGetContextThread.
A user suggests calling the undocumented and unexported function, PspGetContextThreadInternal, of which there is very little reference to on google, save for unknowncheats results.
I don’t know what is up with Binary Ninja lately, but yet again it looks like it has let me down (or user error?). The function signature according to Binja has 7 arguments:
int64_t PspGetContextThreadInternal(int64_t arg1, int64_t arg2, void* arg3, void* arg4, char arg5, char arg6, char arg7);
Which if you read the unknowncheats thread, differs from what they were discussing. Hmm, maybe the function signature has changed since those posts. To be sure, lets check in Ida (which is not letting me down [so far] where binja does):
__int64 PspGetContextThreadInternal(struct _KTHREAD *a1, __int64 a2, unsigned __int8 a3, char a4, char a5);
Ok well, this is only 5 args! Which matches what unknowncheats have posted.
Exported vs Unexported functions
When Windows loads a kernel driver, it resolves the driver’s imported functions against the kernel’s own export tables (primarily ntoskrnl.exe). These exported symbols form the supported kernel API that Microsoft allows drivers to call.
Microsoft intentionally exports only a subset of the kernel’s internal routines. These are documented and stable enough for third-party drivers.
The kernel contains many additional routines that are not present in the export table. These unexported functions still exist inside the kernel binary, but they are not part of the official driver ABI. Because they are not exported, drivers cannot link to them at and must locate them dynamically if they choose to use them.
FFI Signature
Given the function is not exported by the kernel, we need to write an Foreign Function Interface signature to match the arguments and format expected by the routine. Taking what we know from the unknowncheats thread, we can define this as so:
type PspGetContextThreadInternal = unsafe extern "system" fn(
    thread: *const c_void,
    ctx: *mut _CONTEXT,
    _: u8,
    _: u8,
    _: u8,
) -> NTSTATUS;
Pattern matching the unexported function
Next, we need to find where this function exists in memory. Because of Kernel Address Space Layout Randomisation (KASLR) the routine will not be at a constant address we can reference between boots.
I already have a function in my Sanctum EDR which scans the kernel for a particular sequence of bytes and returns to us the address of the start of that sequence.
If it would be helpful to publish a standalone crate that does this as a helper for anybody else working at the low level, let me know and I will work on that! I have also used this technique in my Wyrm project. It’s pretty handy for doing cool tricks in memory!
So, how can we use this to find the address of an unexported function using this helper? Well, first we need to find the machine code which makes up the function prologue (and deeper if needed) so we can find these bytes. A word of caution - go deep enough for this to be unique. I spent a little while on a blue screen (I think it was a page fault in non-paged pool..) when calling what I thought was PspGetContextThreadInternal when in fact, I had clearly matched too soon, and was calling the wrong function!
To get the bytes to search for, we can crack open a debugger or disassembler and have a look at the bytes at the beginning of the routine:
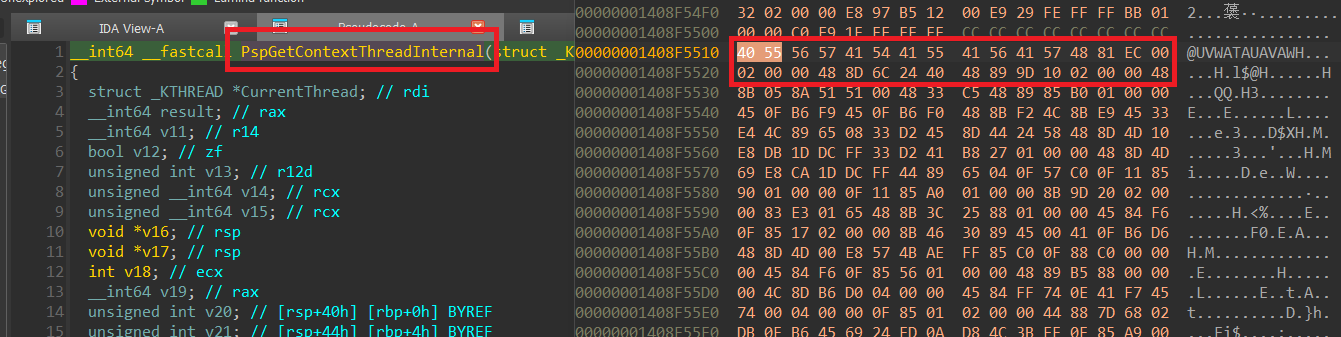
We can now pass this sequence of bytes into my helper function to find the address at the start of the pattern match as so (after resolving ntoskrnl base address and image size, which is in another helper):
let fn_address = scan_module_for_byte_pattern(
    module.base_address,
    module.size_of_image,
    &[
        0x40, 0x55,                                 // push rbp
        0x56,                                       // push rsi
        0x57,                                       // push rdi
        0x41, 0x54,                                 // push r12
        0x41, 0x55,                                 // push r13
        0x41, 0x56,                                 // push r14
        0x41, 0x57,                                 // push r15
        0x48, 0x81, 0xec, 0x00, 0x02, 0x00, 0x00,   // sub rsp, 200h
        0x48, 0x8d, 0x6c, 0x24, 0x40,               // lea rbp, [rsp+40h]
        0x48, 0x89, 0x9d, 0x10, 0x02, 0x00, 0x00,   // mov qword ptr [rbp+210h], rbx
    ],
);
Assuming this returns the address of PspGetContextThreadInternal, which has accounted for KASLR, we can transmute this address to a function pointer with our prototype defined above, thanks to core::mem::transmute.
unsafe { transmute::<_, PspGetContextThreadInternal>(fn_address) };
This enables us to literally call the function. Nice.
Enumerating threads
I have written an iterator which allows the driver to iterate all threads running on the system, so for each thread we do the following in a loop. Assume each ‘thread’ we are iterating is the PETHREAD.
First we check if the thread is terminating or is a system thread, if it is, continue to the next thread (I experienced some stability issues early on which I considered to be because this - some form of race condition or reading bad memory on a system thread).
We need to set up the context structure that we pass into PspGetContextThreadInternal. This is as simple as reserving space for it, and setting the ContextFlags field to CONTEXT_ALL:
let mut ctx = zeroed::<_CONTEXT>();
ctx.ContextFlags = CONTEXT_ALL;
We can now call PspGetContextThreadInternal with our PETHREAD and CONTEXT structure. I copied the parameters for args 3, 4 and 5 from
unknowncheats:
let status = PspGetContextThreadInternal(
    pe_thread,
    &mut ctx,
    KernelMode as u8,
    UserMode as u8,
    KernelMode as u8,
);

if !nt_success(status) {
    println!("[sanctum][-] Failed to get thread context. {status:#X}.");
    continue;
}
We do not need to suspend the thread before calling this, as I had first thought. I assume if the function is run against a running thread on the CPU it just pulls the last known register values.
Now we have the CONTEXT filled out - we can check the Dr0, Dr1, Dr2, and Dr3 registers to see whether they contain any pointers.
If those fields are empty; then the VEH hunter can proceed to check the next thread. In the event one or more of those registers is not empty, then…
Debug register inspection
We have several options for the next steps - I’m going with the path of least resistance and calling into ZwQueryVirtualMemory to get the image name of the module (this will give us a string of the path to the image, for example - if Dr0 is set at AmsiScanBuffer we can resolve the address in Dr0 to amsi.dll).
We also call ZwQueryVirtualMemory to query against
a MEMORY_BASIC_INFORMATION
to obtain the AllocationBase field, which is the base address of the module in memory. We can then call RtlFindExportedRoutineByName
to get the address of monitored functions, and match that against the address found in the debug registers. As an example
if address 0xfff123456 is the address of AmsiScanBuffer in amsi.dll, we can produce a high fidelity alert to a SIEM that
a process is potentially bypassing AMSI.
To query for the base address we can do as follows, where handle is a handle to the process and offending_address is the address found in one of the debug registers:
let mut mem_info = MEMORY_BASIC_INFORMATION::default();
let mut out_len: u64 = 0;

status = ZwQueryVirtualMemory(
    handle,
    offending_address as _,
    MemoryBasicInformation,
    &mut mem_info as *mut _ as *mut c_void,
    size_of::<MEMORY_BASIC_INFORMATION>() as u64,
    &mut out_len,
);
And to get the module path:
let mut path_buf = [0u8; 512];
// source https://docs.rs/ntapi/latest/ntapi/ntmmapi/constant.MemoryMappedFilenameInformation.html
const MemoryMappedFilenameInformation: MEMORY_INFORMATION_CLASS = 2;

status = ZwQueryVirtualMemory(
    handle,
    offending_address as _,
    MemoryMappedFilenameInformation,
    &mut path_buf as *mut _ as *mut c_void,
    path_buf.len() as u64,
    &mut out_len,
);
if !nt_success(status) {
    println!(
        "[sanctum] [-] Failed to call ZwQueryVirtualMemory 2nd time. Error: {status:#X}"
    );
}

let unicode = &*(path_buf.as_ptr() as *const UNICODE_STRING);

let module_name = if unicode.Length != 0 {
    let s = slice::from_raw_parts(unicode.Buffer, (unicode.Length as usize) / 2);
    String::from_utf16_lossy(s)
} else {
    String::from("Unknown")
};

println!("Module name: {:?}", module_name);
Comparing the address in a debug register to that of a monitored routine
As mentioned above we can check whether the address in a debug register matches the address of a function malware is likely to try bypass as follows:
const SENSITIVE_API_NAMES: [&[u8]; 5] = [
    b"AmsiScanBuffer\0",
    b"AmsiScanString\0",
    b"EtwEventWrite\0",
    b"EtwEventWriteFull\0",
    b"NtTraceEvent\0",
];

/// Searches through a **mapped** module in memory for a series of pre-defined functions that are protected against
/// Vectored Exception Handling abuse through the debug registers. This works against VEH^2 also which was researched
/// first by CrowdStrike.
///
/// # Safety
///
/// This function **MUST** be called whilst attached to a process stack via `KeStackAttachProcess` or it will Bug Check.
///
/// # Args
///
/// - `allocation_base`: The base address of the module you wish to search, with it being a **mapped** image.
/// - `target_address`: The address you are looking to see if it is a monitored, sensitive address.
unsafe fn search_module_for_sensitive_addresses(
    allocation_base: *const c_void,
    target_address: *const c_void,
) -> Option<String> {
    // Some safety..
    if allocation_base.is_null() || target_address.is_null() {
        return None;
    }

    //
    // Iterate through each API name we are monitoring and see if we get a match on the address
    //
    unsafe {
        for name in SENSITIVE_API_NAMES {
            let result = RtlFindExportedRoutineByName(allocation_base, name.as_ptr());
            if result.is_null() {
                continue;
            }

            //
            // Check whether the debug register is set on our API of concern
            //
            if result == target_address {
                let cstr = CStr::from_bytes_with_nul(name)
                    .unwrap_or(CStr::from_bytes_with_nul(b"Unknown\0").unwrap());

                return Some(cstr.to_string_lossy().into_owned());
            }
        }
    }

    None
}
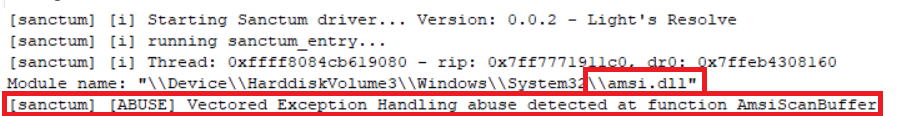
The results
When running this against a process which sets up VEH Squared to bypass AMSI (such as what Wyrm does), you can see that it gets detected by the EDR!
Impact
So, what real world impact does this have? Well, for one, this relies upon undocumented APIs to get a CONTEXT record of each thread. Commercial EDR vendors may choose not to do this as there could be differences between byte patterns between kernel versions which would all need assuring to a suitable standard that they are indeed pointing to the correct routine. Otherwise, you will get into blue screen hell and.. we have already seen in 2025 the impact of that from security vendors. I cannot see any major reason why Microsoft should not consider exporting and officially supporting use of the PspGetContextThreadInternal function. Perhaps behind closed doors Microsoft provide access to a stable API or linkable stub which allows EDR vendors to use this.
Next, techniques such as setting & unsetting registers in tandem with sleep masking could help malware evade this method of detection. Potentially when malware (such as Cobalt Strike) goes to ‘sleep’ it removes VEH debug register hooks such that a random thread scanner has less chance of catching it in action so to speak.
Finally as I mentioned early on, there is the potential for userland hooking of KiUserExceptionDispatcher. This is something potentially to explore,
but again, you are into undocumented land which I would imagine EDR vendors are keen to try stay away from. I suppose to that effect, if NtContinue is
called before execution continues from the tampered CONTEXT makes it to the kernel, could an EDR hook NtContinue and look for the context
structure that is going to be written once execution is passed to the kernel? I would have to spend some time reversing ntdll and the exception handling
mechanism to see whether you can reliably ‘backtrace’ the CONTEXT. A quick google of
the signature of NtContinue does indicate that the first argument (rcx) of the
call is the CONTEXT so.. I suppose.. we could probably do the classic EDR ntdll hook of a syscall stub to look for whether a debug register is
set before allowing execution. This would be an interesting area of research :). Of course, malware can try ways to evade Nt stubs from dispatching,
which is where ‘defence in depth’ comes into play, this time, playfully using that phrase in terms of the technical depth of an EDR to detect various
tampering methods!
Perhaps because Defender is a Microsoft product, that product has the potential to be the best EDR given they can work internally to proprietarily detect things other vendors cannot. Though, I imagine there is some complex law around competition with that (such as whatever it was where Google was fined for trying to stop people using other browsers or whatever.. I forget).
Next steps
As a little ‘next steps’ research for myself, or another peer in the security community:
= Can we hook NtContinue / NtContinueEx as above to detect tampering of the CONTEXT? - Can we hook KiUserExceptionDispatcher as above to detect debug register tampering before the exception is run?
Sources
- https://www.crowdstrike.com/en-us/blog/crowdstrike-investigates-threat-of-patchless-amsi-bypass-attacks/
- https://web.archive.org/web/20031011125738/http://www.microsoft.com/msj/0197/exception/exception.aspx
- https://www.codeproject.com/articles/Internals-of-Windows-Thread
- https://stackoverflow.com/questions/41734911/where-is-a-usermode-thread-context-stored-and-is-it-possible-to-modify
- https://momo5502.com/posts/2024-09-07-a-journey-through-kiuserexceptiondispatcher/
- https://www.unknowncheats.me/forum/c-and-c-/210736-psgetcontextthread-returns-status_unsuccessful.html
- https://www.unknowncheats.me/forum/anti-cheat-bypass/687803-pspgetcontextthreadinternal-createthreadnotifyroutine.html
- https://www.nccgroup.com/research-blog/detecting-anomalous-vectored-exception-handlers-on-windows/
- https://rayanfam.com/topics/hypervisor-from-scratch-part-8/
- https://research.meekolab.com/the-basics-of-intel-vt-x-extensions
- https://cymulate.com/blog/blindside-a-new-technique-for-edr-evasion-with-hardware-breakpoints/
- https://www.ibm.com/think/x-force/using-veh-for-defense-evasion-process-injection
- https://cdrdv2-public.intel.com/825750/326019-sdm-vol-3c.pdf
- https://learn.microsoft.com/en-us/windows-server/virtualization/hyper-v/architecture