好的,我现在需要帮用户总结一篇文章,控制在100字以内。首先,我得仔细阅读文章内容,理解作者的主要目的和方法。 文章的开头提到作者一直在寻找新的方法来处理DShield传感器捕获的数据。这次他用了Gephi和Graphviz这两个工具来分析源IP、文件名和传感器之间的关系。接着,他从ELK数据库中提取了过去30天的数据,并使用ES|QL进行查询和导出,然后导入Gephi进行分析。 文章中展示了两个查询示例,分别导出了不同的数据字段,并且提到了导出的记录数。然后通过Gephi生成的图表,展示了恶意软件活动的分组情况,特别是红尾恶意软件的相关信息。最后列出了几个指标,包括IP地址和文件哈希值。 现在我要把这些信息浓缩到100字以内。首先确定主要信息:使用Gephi分析DShield数据,提取源IP、文件名、传感器信息,并生成图表展示恶意软件活动,特别是红尾恶意软件的情况。 需要注意的是,用户要求不要以“文章内容总结”或“这篇文章”这样的开头,直接写描述即可。同时要控制在100字以内。 所以最终的总结应该是:作者利用Gephi和Graphviz分析DShield传感器数据,提取源IP、文件名及传感器信息,并生成图表展示恶意软件活动关系,尤其是红尾恶意软件的分组情况。 检查一下字数是否符合要求,并确保关键点都涵盖在内。 </think> 作者利用Gephi和Graphviz工具分析DShield传感器数据,提取源IP、文件名及传感器信息,并生成图表展示恶意软件活动关系,尤其是红尾恶意软件的分组情况。 2026-1-8 00:13:26 Author: isc.sans.edu(查看原文) 阅读量:28 收藏
I'm always looking for new ways of manipulating the data captured by my DShield sensor [1]. This time I used Gephi [2] and Graphiz [3] a popular and powerful tool for visualizing and exploring relationships between nodes, to examine the relationship between the source IP, filename and which sensor got a copy of the file. I queried the past 30 days of data stored in my ELK [4] database in Kibana using ES|QL [5][6] to query and export the data and import the result into Gephi.
This is the query I used to export the data I needed. Notice the field event.reference == "no match" which is a tag that filters all the know researchers [7] added by Logstash as a tag.
Kibana ES|QL Query from Analytics → Discover
FROM cowrie*
| WHERE event.reference == "no match"
| KEEP related.ip, file.name, host.name
| WHERE file.name IS NOT NULL
| LIMIT 10000

This second example exports the source IP, file hash and filename. This query exported 2685 records for a period of 30 days of data.
FROM cowrie*
| WHERE event.reference == "no match"
| KEEP related.ip, related.hash, file.name
| WHERE file.name IS NOT NULL
| LIMIT 10000
This screenshot shows one of the 2 groups of malware activity that contains various files. This is the first grouping of the files with multiple hashes and IP addresses for the same filename.

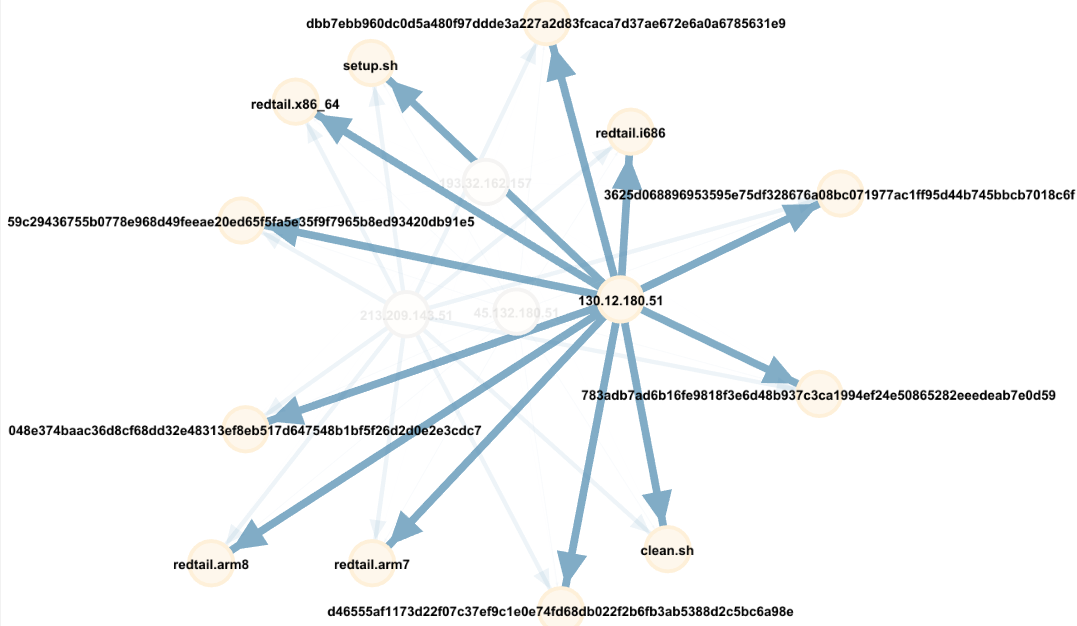
The second grouping of IPs, filename and hashes are all related to redtail malware.

One of the nice things with Gephi is where you can put the cursor on a specific type of activity to show the overall relationship from that point view and push the unselected data into the background. Using this graph and selecting with the cursor on IP 130.12.180.51 that uploaded several times (large blue arrow) shows the redtail malware by IP 130.12.180.51 over the past 30 days and the with all the files matching hashes.

Indicators
45.132.180.51
130.12.180.51
193.32.162.157
213.209.143.51
783adb7ad6b16fe9818f3e6d48b937c3ca1994ef24e50865282eeedeab7e0d59
59c29436755b0778e968d49feeae20ed65f5fa5e35f9f7965b8ed93420db91e5
048e374baac36d8cf68dd32e48313ef8eb517d647548b1bf5f26d2d0e2e3cdc7
dbb7ebb960dc0d5a480f97ddde3a227a2d83fcaca7d37ae672e6a0a6785631e9
d46555af1173d22f07c37ef9c1e0e74fd68db022f2b6fb3ab5388d2c5bc6a98e
3625d068896953595e75df328676a08bc071977ac1ff95d44b745bbcb7018c6f
[1] https://isc.sans.edu/diary/Analysis+of+SSH+Honeypot+Data+with+PowerBI/28872
[2] https://gephi.org/
[3] https://www.graphviz.org/download/
[4] https://github.com/bruneaug
[5] https://www.elastic.co/guide/en/elasticsearch/reference/8.19/esql-using.html
[6] https://isc.sans.edu/diary/Using+ESQL+in+Kibana+to+Queries+DShield+Honeypot+Logs/31704
[7] https://isc.sans.edu/api/threatcategory/research?json
[8] https://gephi.org/quickstart/
-----------
Guy Bruneau IPSS Inc.
My GitHub Page
Twitter: GuyBruneau
gbruneau at isc dot sans dot edu
如有侵权请联系:admin#unsafe.sh