文章探讨了针对Proxmox虚拟化环境的攻击技术及其防御策略,包括Guest Agent滥用、vsock通信、直接磁盘访问等攻击手段,并提供了任务日志分析、审计规则配置和实时监控等检测方法。 2025-12-6 23:50:48 Author: blog.zsec.uk(查看原文) 阅读量:42 收藏
I wrote a blog post all about attacking Proxmox, some of the living off the land techniques that can be used over and above the standard Linux attacks. This serves as a second part strictly for defenders and show some of the scenarios that you may have not thought about.
This post is designed to help defenders understand what attacker activity looks like in Proxmox environments, where to find evidence, and how to improve detection coverage.
Understanding Proxmox
Proxmox has become increasingly popular in enterprise environments, home labs, and managed service providers. Its open source nature and lack of licensing costs make it attractive, but this also means security teams often inherit Proxmox infrastructure without the same vendor support and detection tooling that comes with VMware or Hyper-V.
The problem is that Proxmox, like any hypervisor, represents a tier zero asset. If an attacker compromises your Proxmox host, they effectively own every virtual machine running on it. Worse still, many of the techniques used to abuse Proxmox leave minimal traces in default logging configurations.
This post walks through what attackers can do on a compromised Proxmox host, where evidence of that activity lives, and how to improve your detection capabilities without relying on any specific EDR or SIEM platform.
Learn What You Are Defending
Before diving into detection, it helps to understand what makes Proxmox different from other hypervisors.
Proxmox is essentially Debian Linux with a virtualisation management layer on top. This means two things for defenders. First, all your standard Linux detection and hardening approaches apply. Second, there is an additional layer of Proxmox specific tooling that attackers can abuse, and this tooling has its own logging gaps.
The key components worth understanding are:
pve-clusterhandles configuration synchronisation across cluster nodes. All cluster configuration lives in/etc/pve, which is actually a FUSE filesystem that replicates changes to every node automatically.qmandpctare the command line tools for managing QEMU virtual machines and LXC containers respectively. These are the primary tools attackers will use for enumeration and execution.- The QEMU guest agent is a service that runs inside VMs and allows the hypervisor to execute commands, read files, and write files inside the guest. If this is enabled on a VM, an attacker with host access can execute arbitrary commands inside that VM without any network connectivity.
vsockis a socket interface that allows direct communication between the hypervisor and guests without using the network stack. This is invisible to all network monitoring tools.
Where Proxmox Keeps Its Logs
Proxmox logging is distributed across multiple locations. Understanding this architecture is critical because attackers will exploit the gaps between these systems.
Primary Log Locations
The task system at /var/log/pve/tasks/ captures most VM operations including guest agent commands, backups, snapshots, and migrations. Each operation gets a unique task ID and its own log file. This is your primary source for detecting administrative actions against VMs.
The API proxy log at /var/log/pveproxy/access.log records all web UI and API access in a standard HTTP access log format. This captures who accessed what endpoints and from which IP addresses.
Standard Linux logs still apply. Authentication events go to /var/log/auth.log, general system events to /var/log/syslog, and the systemd journal captures service level activity.
Per-VM QEMU logs exist at /var/log/pve/qemu-server/<vmid>.log but these typically only contain QEMU startup and error messages, not operational activity. You can find the vmid quick and easily with qm list.
The Task System in Detail
The Proxmox task system deserves special attention because it captures most of the interesting activity. Each task gets a unique identifier called a UPID that encodes useful information.
A UPID looks like this:
UPID:hostname:00012ABC:00001234:12345678:qmexec:100:user@pam:Breaking this down: the hostname identifies which cluster node ran the task, the hex values encode process IDs and timestamps, the task type tells you what operation was performed, the VM ID tells you which VM was targeted, and the user field shows who initiated the action.
You can query recent tasks through the API or by examining the task index file:
# List recent tasks via API
pvesh get /cluster/tasks --limit 50

# Search the task index for specific operation types
grep -E "qmexec|qmagent|vzdump" /var/log/pve/tasks/index

# Find all tasks initiated by a specific user
grep "root@pam" /var/log/pve/tasks/index
Detecting Guest Agent Abuse
The QEMU guest agent is one of the most powerful tools available to an attacker who has compromised a Proxmox host. If a VM has the guest agent enabled and running, the attacker can execute commands inside that VM directly from the hypervisor.
This is significant because the execution happens through a virtio channel, not the network. There is no SSH connection, no RDP session, no network traffic at all. From a network monitoring perspective, this activity is completely invisible.
What Gets Logged
When someone runs qm guest exec, Proxmox creates a task entry. The task log typically includes the command that was executed and its output. This is actually reasonably good logging, but you need to know where to look.
Example task log content:
starting guest agent command 'exec' on VM 100
command: ["/bin/bash", "-c", "id"]
exit code: 0
stdout: uid=0(root) gid=0(root) groups=0(root)
Detection Queries
To find guest agent execution in your environment:
# Find all guest exec tasks from the last 24 hours
find /var/log/pve/tasks -mtime -1 -type f -exec grep -l "guest agent command" {} \;

# Search for reconnaissance commands
grep -r "whoami\|id\|passwd\|shadow" /var/log/pve/tasks/*/

# Monitor task creation in real time
tail -f /var/log/pve/tasks/index | grep -E "qmexec|qmagent"
What to Look For
Legitimate guest agent usage typically follows predictable patterns. Automation tools might use it for health checks or configuration management. What stands out is:
Reconnaissance commands like id, whoami, cat /etc/passwd, or hostname being run interactively rather than as part of automated workflows.
Guest agent commands to VMs that normally would not need them. If you have a database server that has never had guest agent commands run against it, sudden activity is suspicious.
High volumes of guest agent commands in short time periods, particularly across multiple VMs.
Commands executed outside normal maintenance windows or by users who do not typically perform VM administration.
The Quiet Alternative: File Read Operations
Here is where things get problematic. The qm guest file-read command allows reading arbitrary files from inside a guest VM. Unlike command execution, file read operations often generate minimal or inconsistent logging.
An attacker can read /etc/shadow, SSH private keys, AWS credentials, database configuration files, and anything else on the guest filesystem. The file path and contents are typically not logged in the task system.
Detection requires looking at API access logs:
# Check for file-read API calls
grep "file-read" /var/log/pveproxy/access.log
This only works if the attacker used the API directly. Command line usage of qm guest file-read may not appear here at all.
Tip: Enable auditd rules to track execution of the qm binary itself. This catches both API and command line usage:
auditctl -w /usr/sbin/qm -p x -k pve_qmDetecting vsock Activity
vsock is a socket address family that provides communication between the hypervisor and guests without using the network stack. Think of it as a direct pipe between host and VM that bypasses all network controls.
This is the capability that keeps security teams up at night. An attacker can establish a command and control channel over vsock that is completely invisible to:
- Network firewalls
- Network intrusion detection systems
- Packet capture tools
- Flow logging
- Any network based monitoring
The traffic never touches the network. It travels over a virtio PCI device directly between host and guest memory.
What Gets Logged
Nothing, by default. Proxmox has no logging for vsock communication. The only evidence of vsock activity is:
- The vsock kernel module being loaded
- Processes with vsock file descriptors open
- VM configurations that enable vsock
Detection Strategies
Since you cannot log the traffic itself, focus on detecting the preconditions and indicators of vsock usage.
Check if vsock is even possible in your environment:
# Is the kernel module loaded?
lsmod | grep vsock

# Which VMs have vsock enabled?
grep -r "vsock\|vhost-vsock" /etc/pve/qemu-server/
Monitor for vsock socket creation:
# Find processes with vsock sockets open
lsof 2>/dev/null | grep vsock

# Check file descriptors directly
find /proc/*/fd -ls 2>/dev/null | grep vsock
Look for common vsock tools:
# Socat is frequently used for vsock communication
ps aux | grep socat
pgrep -a socat
Tip: Create a baseline of your environment, understanding signal to noise makes life 10x easier if you know what normal looks like. If vsock is not legitimately used in your infrastructure, any vsock module loading or socket creation is immediately suspicious. Add monitoring for these events:
# Audit vsock socket creation
auditctl -a always,exit -F arch=b64 -S socket -F a0=40 -k vsock_socket
The value 40 is the address family number for AF_VSOCK on Linux.
Monitoring Script
Consider running a periodic check for vsock activity:
#!/bin/bash
# Save as /usr/local/bin/vsock-check.sh

VSOCK_FDS=$(lsof 2>/dev/null | grep -c vsock)
if [ "$VSOCK_FDS" -gt 0 ]; then
    logger -p security.warning "vsock file descriptors detected: $VSOCK_FDS"
    lsof 2>/dev/null | grep vsock >> /var/log/vsock-activity.log
fi

# Check for newly enabled vsock on VMs
for conf in /etc/pve/qemu-server/*.conf; do
    if grep -q vsock "$conf" 2>/dev/null; then
        vmid=$(basename "$conf" .conf)
        logger -p security.notice "VM $vmid has vsock enabled"
    fi
done
Run this every five minutes via cron. It will not detect active vsock sessions in real time, but it will alert you to vsock capability being present.
Detecting Direct Disk Access
An attacker with root access on a Proxmox host can mount VM disks directly and access their contents offline. This bypasses all guest operating system controls including file permissions, encryption at rest that relies on the guest OS, and any endpoint protection running inside the VM.
How This Works
Proxmox typically stores VM disks as LVM logical volumes under /dev/pve/ or as ZFS zvols. An attacker can simply mount these:
# Attacker mounts a VM disk
mount /dev/pve/vm-100-disk-0 /mnt/target

# Now they can read anything
cat /mnt/target/etc/shadow
cat /mnt/target/home/user/.ssh/id_rsa
For QCOW2 format disks, they would use qemu-nbd:
modprobe nbd
qemu-nbd --connect=/dev/nbd0 /var/lib/vz/images/100/vm-100-disk-0.qcow2
mount /dev/nbd0p1 /mnt/target
What Gets Logged
Proxmox itself logs nothing about direct disk access. You are relying on standard Linux logging:
- Mount operations may appear in syslog
- The nbd module loading will appear in dmesg
- LVM commands may be logged depending on configuration
Detection Strategies
Monitor for unexpected mounts of VM volumes:
# Check current mounts
mount | grep -E "vm-[0-9]+-disk|nbd"

# Search syslog for mount activity
grep -E "mounted|mount" /var/log/syslog | grep -E "pve|nbd"
Watch for nbd module usage:
# Is nbd loaded?
lsmod | grep nbd

# Are any nbd devices in use?
ls -la /dev/nbd* 2>/dev/null
Tip: Use auditd to monitor disk access tools:
# Monitor mount command
auditctl -w /bin/mount -p x -k mount_ops

# Monitor qemu-nbd
auditctl -w /usr/bin/qemu-nbd -p x -k qemu_nbd

# Monitor LVM tools
auditctl -w /sbin/lvs -p x -k lvm_enum
auditctl -w /sbin/lvcreate -p x -k lvm_ops
Detecting Snapshot and Backup Abuse
Snapshots and backups are legitimate administrative functions, but attackers can abuse them for data exfiltration and credential harvesting.
Memory Snapshots
When a snapshot is created with the vmstate option, it captures the VM's memory contents. This memory dump can be analysed offline to extract:
- Credentials in memory
- Encryption keys
- Session tokens
- Any sensitive data the VM was processing
What Gets Logged
Snapshot operations are well logged in the task system:
INFO: create snapshot 'snap1' for VM 100
INFO: saving VM state and memory
INFO: snapshot 'snap1' created successfully
Detection Queries
# Find all snapshot operations
grep -r "snapshot" /var/log/pve/tasks/index

# Specifically find memory snapshots
find /var/log/pve/tasks -type f -exec grep -l "saving VM state" {} \;

# Find snapshot files on disk
find /var/lib/vz -name "*state*" -mtime -7
What to Look For
Memory snapshots (those with vmstate) are more suspicious than regular disk snapshots. Legitimate use cases for memory snapshots are relatively rare outside of live migration testing.
Snapshots with unusual names or descriptions that do not match your naming conventions deserve investigation.
Snapshots created outside change windows or by unexpected users should be reviewed.
Tip: Monitor the VM configuration directory for changes. Snapshots modify the VM config file:
# Watch for config changes in real time
inotifywait -m /etc/pve/qemu-server/ -e modify
Backup Exfiltration
Backups are even more valuable to attackers because they contain complete VM disk images. An attacker could create a backup and exfiltrate it, or extract an existing backup.
Backup operations are heavily logged:
# Find backup operations
grep "vzdump" /var/log/pve/tasks/index

# Check who triggered backups
grep "vzdump" /var/log/pve/tasks/index | awk -F: '{print $8}' | sort | uniq -c
Compare backup activity against your scheduled backup jobs in /etc/cron.d/vzdump and /etc/pve/vzdump.cron. Any backups not matching your schedule warrant investigation.
Detecting eBPF and Kernel Module Attacks
Advanced attackers may deploy eBPF programs or kernel modules to intercept IO, hide their activity, or establish persistent access. These techniques operate at the kernel level and are difficult to detect without specific monitoring.
eBPF Detection
eBPF allows attaching programs to kernel tracepoints without loading a traditional kernel module. An attacker could use eBPF to intercept all disk IO from VMs, capture network traffic, or monitor system calls.
Check for loaded eBPF programs:
# List all BPF programs
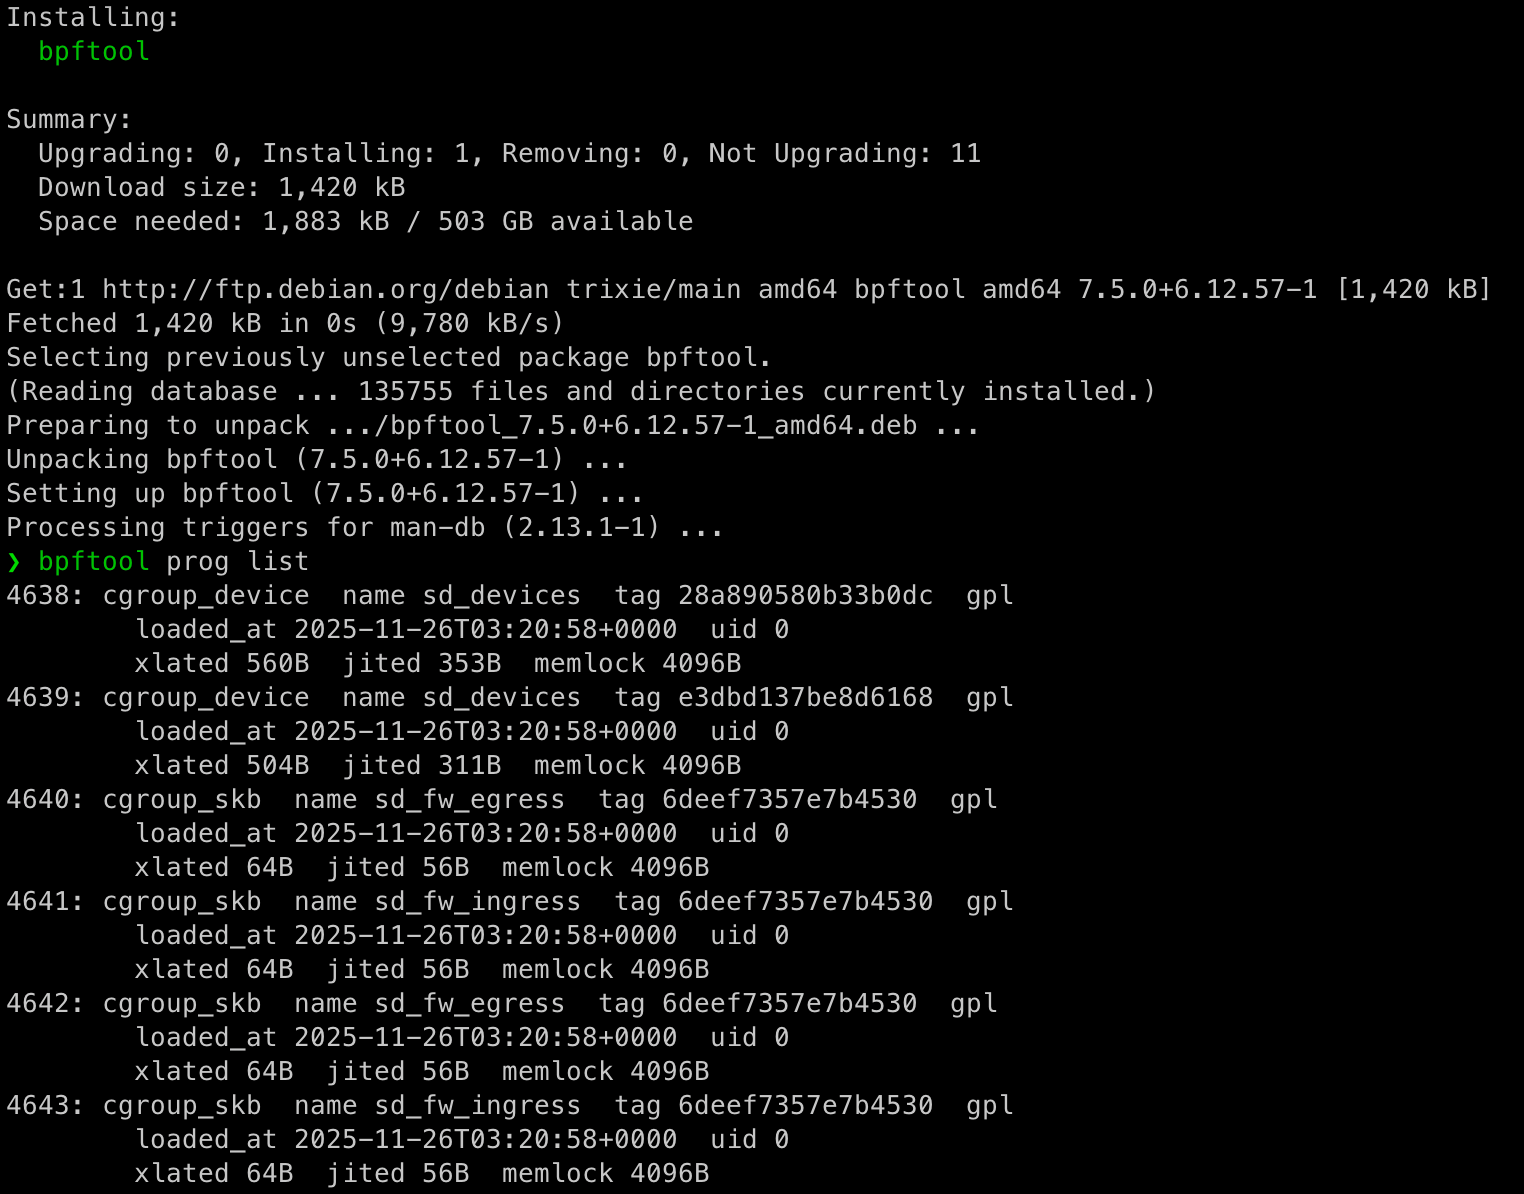
bpftool prog list
# Check for pinned BPF objects
ls -la /sys/fs/bpf/
find /sys/fs/bpf -type f
# List BPF maps (may contain captured data)
bpftool map list
# Check cgroup attachments
bpftool cgroup tree
Look for BPF tooling:
# Common BPF tools
ps aux | grep -E "bpftrace|bpf"
which bpftool bpftrace 2>/dev/null
Tip: Create a baseline of BPF programs in your environment. Most Proxmox installations will have zero or very few BPF programs loaded. Any deviation from this baseline is worth investigating:
# Create baseline
bpftool prog list > /var/lib/bpf-baseline.txt

# Compare periodically
bpftool prog list | diff - /var/lib/bpf-baseline.txt
Kernel Module Detection
Malicious kernel modules can intercept disk IO, hide processes, or provide backdoor access.
Check loaded modules:
# List modules
lsmod
cat /proc/modules

# Check module load configuration
cat /etc/modules-load.d/*.conf
cat /etc/modules

# Find recently modified module files
find /lib/modules/$(uname -r) -name "*.ko" -mtime -7
Look for module hiding:
A sophisticated rootkit might hide itself from lsmod. Compare multiple sources:
# These counts should be similar
lsmod | wc -l
ls /sys/module | wc -l
A large discrepancy may indicate hidden modules.
Tip: Monitor module loading with auditd:
# Audit module syscalls
auditctl -a always,exit -F arch=b64 -S init_module -S finit_module -k module_load
auditctl -a always,exit -F arch=b64 -S delete_module -k module_unload

# Audit module loading tools
auditctl -w /sbin/insmod -p x -k module_load
auditctl -w /sbin/modprobe -p x -k module_load
Detecting Device Mapper Manipulation
Device mapper allows inserting layers between block devices. An attacker could insert a malicious device mapper target between a VM disk and the underlying storage to intercept all IO.
Check current device mapper configuration:
# List device mapper targets
dmsetup ls
dmsetup table

# Check for unusual targets
dmsetup ls --tree
Compare this against your expected configuration. In a standard Proxmox LVM setup, you should see thin pool and thin volume targets for your VMs. Anything unexpected warrants investigation.
Tip: Baseline your device mapper configuration and monitor for changes:
# Create baseline
dmsetup ls > /var/lib/dm-baseline.txt

# Check periodically
dmsetup ls | diff - /var/lib/dm-baseline.txt
Detecting QEMU Binary Tampering
An attacker might replace the QEMU binary with a wrapper that logs VM activity or injects additional capabilities. This is a persistence mechanism that survives VM restarts.
Verify binary integrity:
# Check against package manager
dpkg -V qemu-system-x86

# Or verify hash manually
sha256sum /usr/bin/qemu-system-x86_64
The dpkg verification will show any files that have been modified from the packaged version.
Tip: Include QEMU binaries in your file integrity monitoring. Tools like AIDE, Tripwire, or OSSEC can alert on unexpected changes:
# Quick manual baseline
sha256sum /usr/bin/qemu-system-* > /var/lib/qemu-hashes.txt

# Verify periodically
sha256sum -c /var/lib/qemu-hashes.txt
Comprehensive Audit Configuration
Here is a consolidated auditd configuration that covers the key Proxmox attack vectors. You may need to install it:
sudo apt update
sudo apt install auditd audispd-plugins
# /etc/audit/rules.d/proxmox.rules
# Proxmox management commands
-w /usr/sbin/qm -p x -k pve_qm
-w /usr/sbin/pct -p x -k pve_pct
-w /usr/bin/pvesh -p x -k pve_api
-w /usr/bin/vzdump -p x -k pve_backup
# Storage and disk access
-w /usr/bin/qemu-nbd -p x -k qemu_nbd
-w /sbin/dmsetup -p x -k dm_setup
-w /bin/mount -p x -k mount_ops
-w /sbin/lvs -p x -k lvm_enum
-w /sbin/lvcreate -p x -k lvm_ops
-w /sbin/zfs -p x -k zfs_ops
# Kernel module operations
-a always,exit -F arch=b64 -S init_module -S finit_module -k module_load
-a always,exit -F arch=b64 -S delete_module -k module_unload
-w /sbin/insmod -p x -k module_load
-w /sbin/modprobe -p x -k module_load
# BPF operations
-a always,exit -F arch=b64 -S bpf -k bpf_syscall
-w /usr/sbin/bpftool -p x -k bpf_tool
# vsock socket creation
-a always,exit -F arch=b64 -S socket -F a0=40 -k vsock_socket
# Credential and configuration access
-w /etc/pve/priv -p rwa -k pve_creds
-w /etc/pve/user.cfg -p rwa -k pve_users
-w /etc/pve/corosync.conf -p rwa -k pve_clusterLoad these rules:
auditctl -R /etc/audit/rules.d/proxmox.rulesMake them persistent by ensuring auditd is enabled and the rules file exists.
sudo systemctl enable auditd
sudo systemctl restart auditd
Quick check it's working:
# Should show your rules
sudo auditctl -l | grep pve

# Test by running qm and checking the log
sudo ausearch -k pve_qm
Building a Baseline Monitoring Script
This script performs periodic checks against known good baselines, take it with a massive pinch of salt as I built it in my home lab which is currently a mishmash of several hundred VMs doing all manner of chaos!
#!/bin/bash
# /usr/local/bin/pve-security-check.sh

LOG="/var/log/pve-security.log"
ALERT=0

log_alert() {
    echo "$(date '+%Y-%m-%d %H:%M:%S') ALERT: $1" >> "$LOG"
    logger -p security.alert "PVE Security: $1"
    ALERT=1
}

log_info() {
    echo "$(date '+%Y-%m-%d %H:%M:%S') INFO: $1" >> "$LOG"
}

# Check kernel modules against baseline
if [ -f /var/lib/baseline-modules.txt ]; then
    CURRENT=$(lsmod | awk 'NR>1 {print $1}' | sort)
    BASELINE=$(cat /var/lib/baseline-modules.txt | sort)
    NEW_MODULES=$(comm -23 <(echo "$CURRENT") <(echo "$BASELINE"))
    if [ -n "$NEW_MODULES" ]; then
        log_alert "New kernel modules detected: $NEW_MODULES"
    fi
fi

# Check BPF programs
BPF_COUNT=$(bpftool prog list 2>/dev/null | grep -c "^[0-9]")
BASELINE_BPF=$(cat /var/lib/baseline-bpf-count.txt 2>/dev/null || echo "0")
if [ "$BPF_COUNT" -gt "$BASELINE_BPF" ]; then
    log_alert "BPF program count increased from $BASELINE_BPF to $BPF_COUNT"
fi

# Check for vsock activity
VSOCK_FDS=$(lsof 2>/dev/null | grep -c vsock)
if [ "$VSOCK_FDS" -gt 0 ]; then
    log_alert "Active vsock file descriptors: $VSOCK_FDS"
fi

# Check device mapper configuration
if [ -f /var/lib/baseline-dm.txt ]; then
    CURRENT_DM=$(dmsetup ls 2>/dev/null | sort)
    BASELINE_DM=$(cat /var/lib/baseline-dm.txt | sort)
    if [ "$CURRENT_DM" != "$BASELINE_DM" ]; then
        log_alert "Device mapper configuration changed"
    fi
fi

# Verify QEMU binary integrity
if [ -f /var/lib/qemu-hashes.txt ]; then
    if ! sha256sum -c /var/lib/qemu-hashes.txt >/dev/null 2>&1; then
        log_alert "QEMU binary integrity check failed"
    fi
fi

# Check for unexpected VM disk mounts
DISK_MOUNTS=$(mount | grep -E "vm-[0-9]+-disk|nbd[0-9]")
if [ -n "$DISK_MOUNTS" ]; then
    log_alert "VM disk mounted directly: $DISK_MOUNTS"
fi

# Check for recent activity in guest VMs outside normal business hours
HOUR=$(date +%H)
if [ "$HOUR" -lt 7 ] || [ "$HOUR" -gt 19 ]; then
    RECENT_AGENT=$(find /var/log/pve/tasks -mmin -60 -type f -exec grep -l "guest agent" {} \; 2>/dev/null)
    if [ -n "$RECENT_AGENT" ]; then
        log_alert "Guest agent activity outside business hours"
    fi
fi

if [ $ALERT -eq 0 ]; then
    log_info "Security check completed, no alerts"
fi
Create the baselines:
# Module baseline
lsmod | awk 'NR>1 {print $1}' | sort > /var/lib/baseline-modules.txt

# BPF baseline
bpftool prog list 2>/dev/null | grep -c "^[0-9]" > /var/lib/baseline-bpf-count.txt

# Device mapper baseline
dmsetup ls 2>/dev/null | sort > /var/lib/baseline-dm.txt

# QEMU hash baseline
sha256sum /usr/bin/qemu-system-x86_64 > /var/lib/qemu-hashes.txt
Schedule the check:
echo "*/15 * * * * root /usr/local/bin/pve-security-check.sh" > /etc/cron.d/pve-securityConfiguration Change Monitoring
Monitor the Proxmox configuration directory for real time change detection:
#!/bin/bash
# /usr/local/bin/pve-config-monitor.sh

inotifywait -m -r /etc/pve -e modify -e create -e delete --format '%w%f %e' |
while read file event; do
    logger -p security.notice "PVE config change: $event on $file"

    # Extra alerting for sensitive files
    case "$file" in
        *user.cfg*|*token.cfg*|*priv/*)
            logger -p security.warning "Sensitive PVE config modified: $file"
            ;;
        *corosync.conf*)
            logger -p security.warning "Cluster config modified: $file"
            ;;
    esac
done
Run as a systemd service:
# /etc/systemd/system/pve-config-monitor.service
[Unit]
Description=PVE Configuration Monitor
After=pve-cluster.service

[Service]
ExecStart=/usr/local/bin/pve-config-monitor.sh
Restart=always

[Install]
WantedBy=multi-user.target
Detection Summary
Here is a quick reference of what is detectable and how:
| Technique | Default Visibility | With Hardening | Primary Detection Method |
|---|---|---|---|
| Guest agent exec | Medium | Good | Task logs plus auditd |
| Guest agent file read | Poor | Medium | API logs plus auditd |
| vsock communication | None | Medium | Process monitoring plus auditd |
| Direct disk mount | Poor | Good | Auditd plus mount monitoring |
| Snapshot abuse | Good | Good | Task logs |
| Backup exfiltration | Good | Good | Task logs plus schedule comparison |
| eBPF programs | None | Good | bpftool plus auditd |
| Kernel modules | Poor | Good | Auditd plus baseline comparison |
| QEMU tampering | None | Good | File integrity monitoring |
| Device mapper abuse | Poor | Good | Baseline comparison |
| API token theft | Poor | Medium | File access auditing |
| Config changes | None | Good | inotify monitoring |
Considerations
Proxmox out of the box has significant visibility gaps for host level attacks. The guest agent, vsock, and direct disk access capabilities provide attackers with powerful options that generate minimal logging.
Improving your detection posture requires layering multiple approaches:
- Enable
auditdwith Proxmox specific rules to capture command execution and syscalls that default logging misses. - Create and maintain baselines for kernel modules, eBPF programs, device mapper configuration, and critical binary hashes. Alert on any deviation.
- Monitor the configuration directory in real time using
inotify. Configuration changes, especially to authentication and cluster settings, should generate alerts. - Correlate task logs with expected activity. Guest agent commands, backups, and snapshots outside normal patterns deserve investigation.
- Assume vsock is dangerous until proven otherwise. If you are not using it legitimately, any vsock activity is suspicious.
- Ship your logs centrally. Local logs can be tampered with by an attacker with root access.
The techniques described in this post are all things that a motivated attacker will use against your Proxmox infrastructure. The difference between a successful and unsuccessful attack often comes down to whether you have the visibility to detect it early enough to respond.
如有侵权请联系:admin#unsafe.sh