文章讨论了检测工程中常被忽视的维护问题,并介绍了通过自动化监控和调整检测规则以确保其有效性和及时性的方法。 2025-10-7 08:0:0 Author: blog.nviso.eu(查看原文) 阅读量:35 收藏
Maintenance is often one of the most overlooked aspects of detection engineering [1]. It is not uncommon to see deployed detections generating thousands of alerts, many of which have never been reviewed or had allow lists applied. Additionally, SIEMs and EDRs often fall short in providing effective out of the box features for this phase of the Detection Development Life Cycle (DDLC) that we went through in Part 1. They typically offer minimal functionality or no tools to support the monitoring and tuning of rules, leaving detection engineers with the tedious task of manually ensuring that detections remain effective and up-to-date.
In previous parts of this series, we focused on methods and automations designed to ensure quality and consistency within our repository. These efforts have largely focused on validations that manage rules prior to their deployment in the target platform. In this part, we are going to introduce automation to effectively monitor our deployed detections. By setting up automations at this phase we adopt a proactive approach towards maintenance, allowing our team to take action before a blowout of alerts or an untuned detection is escalated by the SOC or the customer.
Monitoring Checks
We will split the checks that we are going to perform into 4 types.
- Trigger rate of detections – Identify the average triggering rate for detections in our repository.
- Entities triggering rate – Identify the number of appearances of entities for detections in our repository.
- Detection tampering – Monitor and report when any detections from our repository that are disabled or deleted.
- Detection health – Track daily and monthly failure rates of detections in the repository, and report any health issues.
Our end goal is to automate the checks above and automatically create Azure DevOps work item tasks for each identified issue that we need to tackle in our detections.
For reference, work items, in Azure DevOps, are used to track features, requirements, code defects, bugs, and project issues [2].

App Registration
In order to be able to access the Log Analytics API, where our deployed detections have been deployed, and query the workspace for the information above, we need to create an App registration in Azure (or assign an additional role to the app registration created on Part 6).
The App registration for Sentinel must be assigned with the Log Analytics Reader role [3] that allows it to query the API endpoints [4] that we need to get this information. This is a necessary step, so that the API consumer will be able authenticate and use that API. The assignment can be done under the Log Analytics workspace settings -> Access Control (IAM) -> Role Assignments.

Monitoring Detection Trigger Rate and Entities Appearances
To monitor the trigger rate for our detections as well as the number of entities appearances we will create a query that analyses security incidents in Sentinel over a specified lookback period and calculates the following values:
- Title – The title of the incident.
- RelatedAnalyticRuleId – The sentinel rule id that generated the incident.
- IncidentCount – The number of incidents for the specified search period.
- MinDateTime – First occurrence of the incident within the search period.
- MaxDateTime – Last occurrence of the incident within the search period.
- DaysBetweenMinMax – Days between the first and last occurrence.
- Occurences – Number of appearances (in days) for each incident for the specified search period (e.g. appeared 10 times in 30 days).
- DailyOccurenceAvg – Average incidents generated per day for the days the incident appeared.
- DailyOccurenceStdDev – Standard deviation per day of incidents generated for the days the incident appeared.
- SearchDurationDays – Search period in days – the default is set to 30 days, which should provide a sufficient time period to extract representative statistics.
- FullSearchDailyAvg – Average incidents generated per day for the search period days.
- FullSearchDailyStdDev – Standard deviation per day of incidents for the search period days.
- EntitiesAppearances – An array with entities and the number of their appearance in generated incidents and alerts.
The query will filter the results based on two thresholds, incident_count_threshold and incident_avg_threshold. These thresholds are used to determine which incidents are included in the final output based on the following conditional logic:
- Both Thresholds Active – If both thresholds are set to values other than -1, the query filters incidents where either the total count exceeds incident_count_threshold or the average daily occurrence exceeds incident_avg_threshold.
- Incident Count Only – If only incident_count_threshold is active (meaning not -1), the query filters based on total incident count alone.
- Incident Average Only – If only incident_avg_threshold is active, the query filters based on average daily occurrence alone.
- No Thresholds – If both thresholds are -1, the query includes all incidents without applying any filters.
The query crafted according to the requirements above is the following:
let lookback_time = 30d;
let incident_count_threshold = -1;
let incident_avg_threshold = -1;
let incidents =
    SecurityIncident
    | where TimeGenerated > ago(lookback_time)
    | where ProviderName == "Azure Sentinel"
    | mv-expand RelatedAnalyticRuleId = RelatedAnalyticRuleIds
    | extend RelatedAnalyticRuleId = tostring(RelatedAnalyticRuleId)
    | project Title, TimeGenerated, Day = startofday(TimeGenerated), RelatedAnalyticRuleId;
let daily_counts =
    incidents
    | summarize DailyCount = count() by Title, RelatedAnalyticRuleId, Day;
daily_counts
| join kind=inner (
    incidents
    | summarize
        IncidentCount = count(),
        MinDateTime = min(TimeGenerated),
        MaxDateTime = max(TimeGenerated)
        by Title, RelatedAnalyticRuleId
    )
    on Title and RelatedAnalyticRuleId
| summarize
    IncidentCount = sum(DailyCount),
    MinDateTime = max(MinDateTime),
    MaxDateTime = max(MaxDateTime),
    DailyOccurenceAvg = round(avg(DailyCount), 2),
    Occurences = count(),
    DailyOccurenceStdDev = round(stdev(DailyCount), 2)
    by Title, RelatedAnalyticRuleId
| extend DaysBetweenMinMax = datetime_diff("day", MaxDateTime, MinDateTime) + 1
| extend SearchDurationDays = datetime_diff("day", now(), ago(30d)) + 1
| extend FullSearchDailyAvg = round(todouble(IncidentCount) / todouble(SearchDurationDays), 2)
| extend FullSearchDailyStdDev = round(DailyOccurenceStdDev * sqrt(todouble(Occurences) / todouble(SearchDurationDays)), 2)
| where
    (incident_count_threshold != -1 and incident_avg_threshold != -1 and
    (IncidentCount > incident_count_threshold or FullSearchDailyAvg > incident_avg_threshold))
    or (incident_count_threshold != -1 and incident_avg_threshold == -1 and
    IncidentCount > incident_count_threshold)
    or (incident_count_threshold == -1 and incident_avg_threshold != -1 and
    FullSearchDailyAvg > incident_avg_threshold)
    or (incident_count_threshold == -1 and incident_avg_threshold == -1)
| project-reorder
    Title,
    RelatedAnalyticRuleId,
    IncidentCount,
    MinDateTime,
    MaxDateTime,
    DaysBetweenMinMax,
    Occurences,
    DailyOccurenceAvg,
    DailyOccurenceStdDev,
    SearchDurationDays,
    FullSearchDailyAvg,
    FullSearchDailyStdDev
| join kind = leftouter (SecurityIncident
    | where TimeGenerated > ago(lookback_time)
    | where ProviderName == "Azure Sentinel"
    | project IncidentNumber, IncidentName, Title, RelatedAnalyticRuleIds, AlertIds
    | mv-expand AlertId = AlertIds
    | extend AlertId = tostring(AlertId)
    | join kind = inner (
        SecurityAlert
        | where TimeGenerated > ago(lookback_time)
        | where ProductName == "Azure Sentinel" and ProductComponentName == "Scheduled Alerts"
        | project SystemAlertId, AlertName, Entities, AlertType
        | extend AnalyticRuleId = split(AlertType, "_")[-1]
        | mv-expand Entities = todynamic(Entities)
        | mv-expand Entities = todynamic(Entities)
        | mv-expand kind=array key = bag_keys(Entities)
        | extend
            PropertyName = tostring(key),
            PropertyValue = tostring(Entities[tostring(key)])
        | where not(PropertyName startswith "$") and PropertyName != ""
        | where PropertyName != "Type"
        )
        on $left.AlertId == $right.SystemAlertId
    | extend AnalyticRuleId = tostring(AnalyticRuleId)
    | summarize
        EntitiesIncidentCount = count_distinct(IncidentNumber),
        EntitiesAlertCount = count_distinct(SystemAlertId),
        IncidentNumbers=make_set(IncidentNumber),
        SystemAlertIds=make_set(SystemAlertId),
        AlertNames = make_set(AlertName)
        by Title, AnalyticRuleId, PropertyName, PropertyValue
    | project-reorder
        Title,
        AnalyticRuleId,
        PropertyName,
        PropertyValue,
        EntitiesIncidentCount,
        EntitiesAlertCount,
        AlertNames,
        IncidentNumbers,
        SystemAlertIds
    | extend EntitiesAppearancesFormatted = strcat(PropertyName, ": ", PropertyValue, ", ", "IncidentCount: ", EntitiesIncidentCount, "<br />")
    | extend EntitiesAppearances = pack(PropertyName, PropertyValue, "IncidentCount", EntitiesIncidentCount)
    | order by toint(EntitiesAppearances.IncidentCount) desc
    | summarize
        EntitiesAppearancesFormatted = make_list(EntitiesAppearancesFormatted),
        EntitiesAppearances = make_list(EntitiesAppearances)
        by AnalyticRuleId, Title
    )
    on $left.Title == $right.Title and $left.RelatedAnalyticRuleId == $right.AnalyticRuleId
| project-away Title1, AnalyticRuleId
Kusto
A sample output from the query is shown in the following screenshot.

At this point the query returns incidents triggered by all detections that exist in our Sentinel instance. We will further filter the results, in code, in a following section, to limit them only to incidents that were generated from detections in our repository.
Monitoring Detection Tampering and Health
To monitor both detection tampering and the overall health of our detections, we need to enable health and audit logging in Microsoft Sentinel [5], which is disabled by default. Once enabled in the Sentinel settings with a singe click, audit and health logs will begin populating the following tables in our workspace.
- SentinelHealth (non billable)
- SentinelAudit (billable – low volume)

Starting with detection tampering, we will create two queries on the audit events. The first will identify unauthorized deletions of analytic rules, and the second will detect instances where analytic rules were disabled.
On the detection health part, we will develop three queries using both audit and health events. The first identifies rules that were automatically disabled by Sentinel after too many consecutive execution failures. The second and third query calculate the execution success and failure ratios for each detection rule in the repository on a daily and monthly basis, returning results that exceed the predefined thresholds values for each period.
On our query, we use the following fields:
- SentinelResourceName – The analytic rule title.
- RuleId – The analytic rule id.
- work_item_title – The title for the auto-generated work item on DevOps.
- work_item_description – The description for the auto-generated work item on DevOps.
- severity – The severity for the auto-generated work item on Devops.
- MonthlyRuleExecutions – The total number of rule executions the last month.
- MonthlyRuleUnsuccessfulExecutions – The total number of failed rule executions the last month.
- MonthlyRuleSuccessfulExecutions – The total number of successful rule executions the last month.
- monthly_success_rate – The monthly success ratio (%).
- monthly_failure_rate – The monthly failure ratio (%).
- DailyRuleExecutions – The total number of rule executions the last day.
- DailyRuleUnsuccessfulExecutions – The total number of failed rule executions the last day.
- DailyRuleSuccessfulExecutions – The total number of successful rule executions the last day.
- daily_success_rate – The daily success ratio (%).
- daily_failure_rate – The daily failure ratio (%).
Also, we are using the monthly_failures_ratio_threshold and daily_failures_ratio_threshold variables to define threshold values for detection rules that fail regularly, and the arrays deleted_rules_authorized_entities and disabled_rules_authorized_entities used to filter out entities or accounts authorized to delete or disable detection rules.
The query is the following:
let lookback_time = 30d;
let deleted_rules_authorized_entities = dynamic([]);
let disabled_rules_authorized_entities = dynamic([]);
let monthly_failures_ratio_threshold = 20;
let daily_failures_ratio_threshold = 70;
let rule_deleted_results =
    SentinelAudit
    | where TimeGenerated > ago(lookback_time)
    | where Status == 'Success'
    | where SentinelResourceType == 'Analytic Rule'
    | where Description == "Analytics rule deleted"
    | extend
        caller_name = tostring(ExtendedProperties.CallerName),
        caller_ip_address = tostring(ExtendedProperties.CallerIpAddress),
        RuleId = tostring(ExtendedProperties.ResourceId)
    | where caller_name !in~ (deleted_rules_authorized_entities)
    | project
        TimeGenerated,
        SentinelResourceName,
        original_description = Description,
        RuleId,
        work_item_title = strcat('🗑️ Analytics Rule Deleted [RuleId: ', RuleId, ']'),
        work_item_description = strcat('The analytics rule ', SentinelResourceName, ' was deleted on ', format_datetime(TimeGenerated, 'MM-dd-yyyy HH:mm:ss'), ', by the entity ', caller_name, ' who logged in using the IP address ', caller_ip_address, '.\n<br />It is recommended to confirm the above activity.'),
        severity = 'High'
;
let rule_disabled_results =
    SentinelAudit
    | where Status == 'Success'
    | where SentinelResourceType == 'Analytic Rule'
    | where ExtendedProperties.ResourceDiffMemberNames has 'Properties.Enabled'
    | extend
        caller_name = tostring(ExtendedProperties.CallerName),
        caller_ip_address = tostring(ExtendedProperties.CallerIpAddress),
        RuleId = tostring(ExtendedProperties.ResourceId)
    | where caller_name !in~ (disabled_rules_authorized_entities)
    | extend
        WasEnabled = extract(@',"enabled":(\w+),.*}}', 1, tostring(ExtendedProperties.OriginalResourceState)),
        IsEnabled = extract(@',"enabled":(\w+),.*}}', 1, tostring(ExtendedProperties.UpdatedResourceState))
    // Keep only rules that were enabled before, and are disabled now
    | where WasEnabled =~ 'true' and IsEnabled =~ 'false'
    | project
        TimeGenerated,
        SentinelResourceName,
        original_description = Description,
        RuleId,
        work_item_title = strcat('🚩 Analytics Rule Disabled [RuleId: ', RuleId, ']'),
        work_item_description = strcat('The analytics rule ', SentinelResourceName, ' was disabled on ', format_datetime(TimeGenerated, 'MM-dd-yyyy HH:mm:ss'), ', by the entity ', caller_name, ' who logged in using the IP address ', caller_ip_address, '.\n<br />It is recommended to confirm the above activity.'),
        severity = 'High'
;
let rule_auto_disabled_results =
    SentinelHealth
    | where TimeGenerated > ago(lookback_time)
    | where SentinelResourceType == 'Analytics Rule'
    | where Description has "Rule failed to run on multiple occasions and has been disabled"
    | extend RuleId = tostring(ExtendedProperties.RuleId)
    | project
        TimeGenerated,
        SentinelResourceName,
        Reason,
        original_description = Description,
        RuleId,
        work_item_title = strcat('🚨 Analytics Rule Auto-Disabled [RuleId: ', RuleId, ']'),
        work_item_description = strcat('The analytics rule ', SentinelResourceName, ' was automatically disabled on ', format_datetime(TimeGenerated, 'MM-dd-yyyy HH:mm:ss'), ', and it will stop executing based on its configured schedule.'),
        severity = 'High'
;
let rule_failed_to_run_daily_rates =
    SentinelHealth
    | where TimeGenerated > ago(lookback_time)
    | where SentinelResourceType == 'Analytics Rule'
    | where OperationName endswith "rule run"
    | summarize
        DailyRuleExecutions = todouble(count()),
        DailyRuleUnsuccessfulExecutions = todouble(countif(Status == 'Failure')),
        DailyRuleSuccessfulExecutions = todouble(countif(Status == 'Success')),
        make_set(Status, 5),
        FailuresDescription = make_set_if(Description, Status == 'Failure', 10),
        FailuresReason = make_set_if(Reason, Status == 'Failure', 20)
        by
        SentinelResourceName,
        RuleId = tostring(ExtendedProperties.RuleId),
        bin(TimeGenerated, 1d)
    | extend
        daily_success_rate = round((100.0 * (DailyRuleSuccessfulExecutions / DailyRuleExecutions)), 2),
        daily_failure_rate = round((100.0 * (DailyRuleUnsuccessfulExecutions / DailyRuleExecutions)), 2)
    | project-reorder SentinelResourceName, daily_success_rate, daily_failure_rate, RuleId
    | where daily_failure_rate > daily_failures_ratio_threshold
    | extend
        work_item_title = strcat('⚠️ Daily Rule Failure Ratio Reached [RuleId: ', RuleId, ']'),
        work_item_description = strcat(
                                    'The analytics rule ',
                                    SentinelResourceName,
                                    ' exceeded the daily failure threshold on ',
                                    format_datetime(TimeGenerated, 'MM-dd-yyyy'),
                                    '.\n<br />\n<br />Daily Failure Rate: ',
                                    daily_failure_rate,
                                    '\n<br />Daily Success Rate: ',
                                    daily_success_rate,
                                    '\n<br />Daily Rule Executions: ',
                                    DailyRuleExecutions,
                                    '\n<br />Daily Rule Successful Executions: ',
                                    DailyRuleSuccessfulExecutions,
                                    '\n<br />Daily Rule Failed Executions: ',
                                    DailyRuleUnsuccessfulExecutions,
                                    '\n<br />\n<br />It is recommended to investigate the execution errors and tune the rule query.'
                                ),
        severity = 'Medium'
;
let rule_failed_to_run_monthly_rates =
    SentinelHealth
    | where TimeGenerated > ago(lookback_time)
    | where SentinelResourceType == 'Analytics Rule'
    | where OperationName endswith "rule run"
    | summarize
        MonthlyRuleExecutions = todouble(count()),
        MonthlyRuleUnsuccessfulExecutions = todouble(countif(Status == 'Failure')),
        MonthlyRuleSuccessfulExecutions = todouble(countif(Status == 'Success')),
        make_set(Status, 5),
        FailuresDescription = make_set_if(Description, Status == 'Failure', 10),
        FailuresReason = make_set_if(Reason, Status == 'Failure', 20)
        by SentinelResourceName, RuleId = tostring(ExtendedProperties.RuleId)
    | extend
        monthly_success_rate = round((100.0 * (MonthlyRuleSuccessfulExecutions / MonthlyRuleExecutions)), 2),
        monthly_failure_rate = round((100.0 * (MonthlyRuleUnsuccessfulExecutions / MonthlyRuleExecutions)), 2)
    | project-reorder SentinelResourceName, monthly_success_rate, monthly_failure_rate, RuleId
    | where monthly_failure_rate >= monthly_failures_ratio_threshold
    | extend
        work_item_title = strcat('⚠️ Monthly Rule Failure Ratio Reached [RuleId: ', RuleId, ']'),
        work_item_description = strcat(
                                    'The analytics rule ',
                                    SentinelResourceName,
                                    ' exceeded the montly failure threshold for the period ',
                                    format_datetime(ago(30d), "MM-dd-yyyy"),
                                    ' to ',
                                    format_datetime(now(), "MM-dd-yyyy"),
                                    '.\n<br />\n<br />Monthly Failure Rate: ',
                                    monthly_failure_rate,
                                    '\n<br />Monthly Success Rate: ',
                                    monthly_success_rate,
                                    '\n<br />Monthly Rule Executions: ',
                                    MonthlyRuleExecutions,
                                    '\n<br />Monthly Rule Successful Executions: ',
                                    MonthlyRuleSuccessfulExecutions,
                                    '\n<br />Monthly Rule Failed Executions: ',
                                    MonthlyRuleUnsuccessfulExecutions,
                                    '\n<br />\n<br />It is recommended to investigate the execution errors and tune the rule query.'
                                ),
        severity = 'Low'
;
union
    rule_auto_disabled_results,
    rule_deleted_results,
    rule_failed_to_run_monthly_rates,
    rule_failed_to_run_daily_rates,
    rule_disabled_results
| project-reorder work_item_title, work_item_description, severity
A sample output for health and tampering issues is illustrated in the following screenshot.

Similarly to the previous query, the results above contain detection rules that exist in our Sentinel instance. We will further filter the results, in code, in a following section, to limit them only to detection rules that exist in our repository.
Putting It All Together
Automating Work Item Creation from the Pipelines
To be able to create the Azure DevOps work item from a pipeline wee will use the CreateWorkItem extension from the Azure DevOps marketplace [6].
This extension allows us to create work items by defining a step in our pipeline. For example, the following step defines a JSON array of work items, in this case a single task, with specified fields like Title, Description, and Severity. The preventDuplicates: true and keyFields ensure that a work items with the same title are not duplicated, while updateDuplicates: true and updateRules allow existing items to be updated by appending additional text to the description.
- task: CreateWorkItem@2
  displayName: 'Bulk Create Work Items'
  inputs:
    bulkCreate: true
    workItemsJson: |
      [
        {
          "workItemType": "Task",
          "title": "Work item title",
          "fieldMappings": [
            "Description=Insert description here",
            "Severity=Low"
          ],
          "preventDuplicates": true,
          "keyFields": [
            "Title"
          ],
          "updateDuplicates": true,
          "updateRules": "Description|=Appended Description"
        }
      ]
YAML
To control the format of the created work item for each type of check we will once again (see Part 4 and Part 5) use Jinja [7], which is a templating engine. The templates that we are going to use are included below.
For the detection trigger rate and entities appearance the template we are going to use is the following.
[{% for result in results %}
    {
        "workItemType": "Task",
        "title": "{{result.Title}}",
        "fieldMappings": [
            "Description=Report generated at: {{ now_timestamp }}<br />Title: {{ result.Title }}<br />Incidents observed from {{ result.MinDateTime }} to {{ result.MaxDateTime }}<br />Search duration: {{ result.SearchDurationDays }} days<br />Total incidents: {{ result.IncidentCount }}<br />Active days: {{ result.Occurences }} out of {{ result.DaysBetweenMinMax }}<br />Average per active day: {{ result.DailyOccurenceAvg }}<br />StdDev per active day: {{ result.DailyOccurenceStdDev }}<br />Average per day (full search): {{ result.FullSearchDailyAvg }}<br />StdDev per day (full search): {{ result.FullSearchDailyStdDev }}<br />Entities:<br /> {{ result.EntitiesAppearancesFormatted | replace('["', "") | replace('"]', "") | replace('","', "") | replace('"', "\"") }}<br />",
            "Severity={{ 'High' if result.FullSearchDailyAvg > 100 else 'Medium' if result.FullSearchDailyAvg > 10 else 'Low' }}"
        ],
        "preventDuplicates": true,
        "keyFields": ["Title"],
        "updateDuplicates": true,
        "updateRules": "Description|=<br />---<br />Report generated at: {{ now_timestamp }}<br />Title: {{ result.Title }}<br />Incidents observed from {{ result.MinDateTime }} to {{ result.MaxDateTime }}<br />Search duration: {{ result.SearchDurationDays }} days<br />Total incidents: {{ result.IncidentCount }}<br />Active days: {{ result.Occurences }} out of {{ result.DaysBetweenMinMax }}<br />Average per active day: {{ result.DailyOccurenceAvg }}<br />StdDev per active day: {{ result.DailyOccurenceStdDev }}<br />Average per day (full search): {{ result.FullSearchDailyAvg }}<br />StdDev per day (full search): {{ result.FullSearchDailyStdDev }}<br />Entities:<br /> {{ result.EntitiesAppearancesFormatted | replace('["', "") | replace('"]', "") | replace('","', "") | replace('"', "\"") }}<br />"
    }{% if not loop.last %},{% endif %}{% endfor %}
]
Jinja HTML
For the detections tampering and health checks, we will use the following template:
[{% for result in results %}
    {
        "workItemType": "Task",
        "title": "{{result.work_item_title}}",
        "fieldMappings": [
            "Description=Report generated at: {{ now_timestamp }}<br />Title: {{ result.work_item_title }}<br />{{ result.work_item_description }}<br /><br />Rule ID: {{ result.RuleId }}<br />",
            "Severity={{ result.severity }}"
        ],
        "preventDuplicates": true,
        "keyFields": ["Title"],
        "updateDuplicates": true,
        "updateRules": "Description|=<br />---<br />Update generated at: {{ now_timestamp }}<br />Title: {{ result.work_item_title }}<br />{{ result.work_item_description }}<br /><br />Rule ID: {{ result.RuleId }}<br />"
    }{% if not loop.last %},{% endif %}{% endfor %}
]
Detection Monitoring Script
The following script accepts command-line arguments for tenant, platform, template, and detection comparison field, and reads the query from an environment variable. The script first runs a query on the specified platform and retrieves the results. It then, scans the detections directory for metadata YAML files, and builds a dictionary that maps detection IDs to their titles. It filters the results from the platform by matching detection IDs from the query output, using the “detection-compare-field” parameter, with the locally stored detection metadata, to ensure that only Incidents generated by detections in our repository will be present in the output. The filtered results are then passed to the Jinja2 templates and converted into JSON. The work items are exported as a pipeline variable, while the filtered query results are saved to JSON and CSV files.
import argparse
import os
import sys
import json
import yaml
import csv
from lib.platforms import Sentinel
from tabulate import tabulate
from datetime import datetime, timezone
from jinja2 import Environment, FileSystemLoader


def get_repository_detection_info() -> dict:
    """
    Scans the local detections folder for metadata YAML files
    and builds a dictionary mapping detection IDs to their title and version.
    """
    detection_info = {}

    for root, _, files in os.walk("detections"):
        for file in files:
            if file.endswith("_meta.yml"):
                file_path = os.path.join(root, file)
                with open(file_path, "r") as f:
                    try:
                        yaml_content = yaml.safe_load(f)
                        file_id = yaml_content.get("id")
                        title = yaml_content.get("title")
                        version = yaml_content.get("version")

                        if file_id:
                            detection_info[file_id] = {"title": title, "version": version}
                    except yaml.YAMLError as e:
                        print(f"##vso[task.logissue type=error]Error reading {file_path}: {e}")

    return detection_info


def get_results_for_detections_in_repo(results_kv: list, compare_field: str):
    results_for_detections_in_repo = []
    # Load detection metadata from the repo
    repository_detections = get_repository_detection_info()

    for result_line in results_kv:
        compare_value = result_line[compare_field]

        if compare_value.startswith("["):  # If field is a list of IDs
            detection_rule_ids = []
            try:
                # Deserialize the RelatedAnalyticRuleIds field
                detection_rule_ids = json.loads(compare_value)
            except:
                print(f"##vso[task.logissue type=error]Error loading {compare_field} for {result_line}")

            # Check if any rule ID matches our local detections
            for detection_rule_id in detection_rule_ids:
                if detection_rule_id in repository_detections:
                    results_for_detections_in_repo.append(result_line)
                    break  # Stop checking if at least one match is found
        else:  # consider it a string
            if compare_value in repository_detections:
                results_for_detections_in_repo.append(result_line)

    return results_for_detections_in_repo


def run_query_and_generate_work_item_dict(
    tenant: str, platform: str, query: str, template: str, compare_field: str):
    """
    Executes a query against a security platform (e.g. Sentinel),
    filters results based on detections defined in the local repository,
    and prints a summary table of relevant incidents.
    """

    # Initialize platform object and run query
    pl = Sentinel(tenant)
    platform_response = pl.run_query(query)

    if platform_response.success:
        # Extract rows and column headers from the query result
        data = platform_response.data
        columns = [column["name"] for column in data["tables"][0]["columns"]]
        rows = data["tables"][0]["rows"]
        results_kv = [dict(zip(columns, row)) for row in rows]  # Convert to list of dictionaries

        # Loop through results and match  them with detection IDs in repo
        results_for_detections_in_repo = get_results_for_detections_in_repo(results_kv, compare_field)

        # Display the filtered results in a formatted table
        print(tabulate(results_for_detections_in_repo, headers="keys", tablefmt="grid"))

        # Create work items dictionary
        now_timestamp = datetime.now(timezone.utc).strftime("%Y-%m-%d %H.%M.%S UTC")

        if template:
            env = Environment(loader=FileSystemLoader("pipelines/scripts/templates"))
            tmplt = env.get_template(template)
            template_name = os.path.basename(template).removesuffix(".jinja")
            template_content = tmplt.render(results=results_for_detections_in_repo, now_timestamp=now_timestamp)
            print(template_content)
            print(f"##vso[task.setvariable variable={template_name}]{template_content.replace("\n", " ")}")

        # If there are results:
        if len(results_for_detections_in_repo) > 0:
            result_filename = f"results_{now_timestamp}"
            if template:
                result_filename = f"{os.path.basename(template).removesuffix('.jinja')}_results"

            try:
                # Save as JSON file
                with open(f"pipelines/results/{result_filename}.json", 'w') as json_file:
                    json_file.write(json.dumps(results_for_detections_in_repo, indent=4))
            except Exception as e:
                print(f"##vso[task.logissue type=error]Error saving JSON file: {str(e)}")

            try:
                columns_names = results_for_detections_in_repo[0].keys()

                with open(f"pipelines/results/{result_filename}.csv", 'w', newline="", encoding="utf-8") as csv_file:
                    writer = csv.DictWriter(csv_file, fieldnames=columns_names, quoting=csv.QUOTE_ALL)
                    writer.writeheader()
                    writer.writerows(results_for_detections_in_repo)
            except Exception as e:
                print(f"##vso[task.logissue type=error]Error saving CSV file: {str(e)}")


def main():
    parser = argparse.ArgumentParser(description="Alert Monitoring Script")
    parser.add_argument("--tenants", type=str, required=True, help="Tenant to gather stats.")
    parser.add_argument("--platform", type=str, required=True, help="Platform of tenant.")
    parser.add_argument("--template", type=str, help="Templates to use for result output.")
    parser.add_argument(
        "--detection-compare-field", type=str, required=True, help="Query results field to match to repository detection IDs."
    )

    args = parser.parse_args()

    # Read query from environment variable
    query = os.getenv("QUERY")

    if query is None:
        print("QUERY environment variable is not set.")
        sys.exit(1)

    run_query_and_generate_work_item_dict(
        tenant=args.tenants,
        platform=args.platform,
        query=query,
        template=args.template,
        compare_field=args.detection_compare_field,
    )


# Standard Python entry point check
if __name__ == "__main__":
    main()
Python
Detection Monitoring Pipeline
The following pipeline executes the KQL queries, provided above, to gather data on incidents, rule executions, and failures, and processes this data using the python script provided above, to monitor detection trigger rates and performance. The results are published as pipelines artifacts in json and csv format, and work items are created or updated based on the findings if the create_work_items pipeline parameter is set to true. The pipeline is schedule to run once per week but it can also be run manually.
name: Detection Monitoring

trigger: none

schedules:
  - cron: "0 2 * * 1"  # At 01:00 UTC every Monday
    displayName: Weekly run
    branches:
      include:
        - main

parameters:
  - name: lookback_time
    displayName: Lookback Time (days)
    type: number
    default: 30
  - name: incident_count_threshold
    displayName: Incident Count Threshold
    type: number
    default: -1  # -1 disables this check
  - name: incident_avg_threshold
    displayName: Incident Average Threshold
    type: number
    default: -1  # -1 disables this check
  - name: monthly_failures_ratio_threshold
    displayName: Monthly Failures Ratio threshold.
    type: number
    default: 20
  - name: daily_failures_ratio_threshold
    displayName: Daily Failures Ratio threshold.
    type: number
    default: 70
  - name: create_work_items
    displayName: Create work items.
    type: boolean
    default: true

variables:
  kql_query: |
    let lookback_time = ${{ parameters.lookback_time }}d;
    let incident_count_threshold = ${{ parameters.incident_count_threshold }};
    let incident_avg_threshold = ${{ parameters.incident_avg_threshold }};
    let incidents =
        SecurityIncident
        | where TimeGenerated > ago(lookback_time)
        | where ProviderName == "Azure Sentinel"
        | mv-expand RelatedAnalyticRuleId = RelatedAnalyticRuleIds
        | extend RelatedAnalyticRuleId = tostring(RelatedAnalyticRuleId)
        | project Title, TimeGenerated, Day = startofday(TimeGenerated), RelatedAnalyticRuleId;
    let daily_counts =
        incidents
        | summarize DailyCount = count() by Title, RelatedAnalyticRuleId, Day;
    daily_counts
    | join kind=inner (
        incidents
        | summarize
            IncidentCount = count(),
            MinDateTime = min(TimeGenerated),
            MaxDateTime = max(TimeGenerated)
            by Title, RelatedAnalyticRuleId
        )
        on Title and RelatedAnalyticRuleId
    | summarize
        IncidentCount = sum(DailyCount),
        MinDateTime = max(MinDateTime),
        MaxDateTime = max(MaxDateTime),
        DailyOccurenceAvg = round(avg(DailyCount), 2),
        Occurences = count(),
        DailyOccurenceStdDev = round(stdev(DailyCount), 2)
        by Title, RelatedAnalyticRuleId
    | extend DaysBetweenMinMax = datetime_diff("day", MaxDateTime, MinDateTime) + 1
    | extend SearchDurationDays = datetime_diff("day", now(), ago(30d)) + 1
    | extend FullSearchDailyAvg = round(todouble(IncidentCount) / todouble(SearchDurationDays), 2)
    | extend FullSearchDailyStdDev = round(DailyOccurenceStdDev * sqrt(todouble(Occurences) / todouble(SearchDurationDays)), 2)
    | where
        (incident_count_threshold != -1 and incident_avg_threshold != -1 and
        (IncidentCount > incident_count_threshold or FullSearchDailyAvg > incident_avg_threshold))
        or (incident_count_threshold != -1 and incident_avg_threshold == -1 and
        IncidentCount > incident_count_threshold)
        or (incident_count_threshold == -1 and incident_avg_threshold != -1 and
        FullSearchDailyAvg > incident_avg_threshold)
        or (incident_count_threshold == -1 and incident_avg_threshold == -1)
    | project-reorder
        Title,
        RelatedAnalyticRuleId,
        IncidentCount,
        MinDateTime,
        MaxDateTime,
        DaysBetweenMinMax,
        Occurences,
        DailyOccurenceAvg,
        DailyOccurenceStdDev,
        SearchDurationDays,
        FullSearchDailyAvg,
        FullSearchDailyStdDev
    | join kind = inner (SecurityIncident
        | where TimeGenerated > ago(lookback_time)
        | where ProviderName == "Azure Sentinel"
        | project IncidentNumber, IncidentName, Title, RelatedAnalyticRuleIds, AlertIds
        | mv-expand AlertId = AlertIds
        | extend AlertId = tostring(AlertId)
        | join kind = inner (
            SecurityAlert
            | where TimeGenerated > ago(lookback_time)
            | where ProductName == "Azure Sentinel" and ProductComponentName == "Scheduled Alerts"
            | project SystemAlertId, AlertName, Entities, AlertType
            | extend AnalyticRuleId = split(AlertType, "_")[-1]
            | mv-expand Entities = todynamic(Entities)
            | mv-expand Entities = todynamic(Entities)
            | mv-expand kind=array key = bag_keys(Entities)
            | extend
                PropertyName = tostring(key),
                PropertyValue = tostring(Entities[tostring(key)])
            | where not(PropertyName startswith "$") and PropertyName != ""
            | where PropertyName != "Type"
            )
            on $left.AlertId == $right.SystemAlertId
        | extend AnalyticRuleId = tostring(AnalyticRuleId)
        | summarize
            EntitiesIncidentCount = count_distinct(IncidentNumber),
            EntitiesAlertCount = count_distinct(SystemAlertId),
            IncidentNumbers=make_set(IncidentNumber),
            SystemAlertIds=make_set(SystemAlertId),
            AlertNames = make_set(AlertName)
            by Title, AnalyticRuleId, PropertyName, PropertyValue
        | project-reorder
            Title,
            AnalyticRuleId,
            PropertyName,
            PropertyValue,
            EntitiesIncidentCount,
            EntitiesAlertCount,
            AlertNames,
            IncidentNumbers,
            SystemAlertIds
        | extend EntitiesAppearancesFormatted = strcat(PropertyName, ": ", PropertyValue, ", ", "IncidentCount: ", EntitiesIncidentCount, "<br />")
        | extend EntitiesAppearances = pack(PropertyName, PropertyValue, "IncidentCount", EntitiesIncidentCount)
        | order by toint(EntitiesAppearances.IncidentCount) desc
        | summarize
            EntitiesAppearancesFormatted = make_list(EntitiesAppearancesFormatted),
            EntitiesAppearances = make_list(EntitiesAppearances)
            by AnalyticRuleId, Title
        )
        on $left.Title == $right.Title and $left.RelatedAnalyticRuleId == $right.AnalyticRuleId
    | project-away Title1, AnalyticRuleId
  kql_query2: |
    let lookback_time = ${{ parameters.lookback_time }}d;
    let deleted_rules_authorized_entities = dynamic([]);
    let disabled_rules_authorized_entities = dynamic([]);
    let monthly_failures_ratio_threshold = ${{ parameters.monthly_failures_ratio_threshold }};
    let daily_failures_ratio_threshold = ${{ parameters.daily_failures_ratio_threshold }};
        let rule_auto_disabled_results =
        SentinelHealth
            | where TimeGenerated > ago(lookback_time)
            | where SentinelResourceType == 'Analytics Rule'
            | where Description has "Rule failed to run on multiple occasions and has been disabled"
            | extend RuleId = tostring(ExtendedProperties.RuleId)
            | project TimeGenerated, SentinelResourceName, Reason, original_description = Description, RuleId, work_item_title = strcat('🚨 Analytics Rule Auto-Disabled [RuleId: ', RuleId, ']'), work_item_description = strcat('The analytics rule ', SentinelResourceName, ' was automatically disabled on ',  format_datetime(TimeGenerated, 'MM-dd-yyyy HH:mm:ss'), ', and it will stop executing based on its configured schedule.'), severity = 'High'
            ;
        let rule_deleted_results =
        SentinelAudit
            | where TimeGenerated > ago(lookback_time)
            | where Status == 'Success'
            | where SentinelResourceType == 'Analytic Rule'
            | where Description == "Analytics rule deleted"
            | extend caller_name = tostring(ExtendedProperties.CallerName), caller_ip_address = tostring(ExtendedProperties.CallerIpAddress), RuleId = tostring(ExtendedProperties.ResourceId)
            | where caller_name !in~ (deleted_rules_authorized_entities)
            | project TimeGenerated, SentinelResourceName, original_description = Description, RuleId, work_item_title = strcat('🗑️ Analytics Rule Deleted [RuleId: ', RuleId, ']'), work_item_description = strcat('The analytics rule ', SentinelResourceName, ' was deleted on ',  format_datetime(TimeGenerated, 'MM-dd-yyyy HH:mm:ss'), ', by the entity ', caller_name, ' who logged in using the IP address ', caller_ip_address, '.\n<br />It is recommended to confirm the above activity.'), severity = 'High'
        ;
        let rule_disabled_results =
        SentinelAudit
            | where Status == 'Success'
            | where SentinelResourceType == 'Analytic Rule'
            | where ExtendedProperties.ResourceDiffMemberNames has 'Properties.Enabled'
            | extend caller_name = tostring(ExtendedProperties.CallerName), caller_ip_address = tostring(ExtendedProperties.CallerIpAddress), RuleId = tostring(ExtendedProperties.ResourceId)
            | where caller_name !in~ (disabled_rules_authorized_entities)
            | extend
                WasEnabled = extract(@',"enabled":(\w+),.*}}', 1, tostring(ExtendedProperties.OriginalResourceState)),
                IsEnabled = extract(@',"enabled":(\w+),.*}}', 1, tostring(ExtendedProperties.UpdatedResourceState))
            // Keep only rules that were enabled before, and are disabled now
            | where WasEnabled =~ 'true' and IsEnabled =~ 'false'
            | project TimeGenerated, SentinelResourceName, original_description = Description, RuleId, work_item_title = strcat('🚩 Analytics Rule Disabled [RuleId: ', RuleId, ']'), work_item_description = strcat('The analytics rule ', SentinelResourceName, ' was disabled on ',  format_datetime(TimeGenerated, 'MM-dd-yyyy HH:mm:ss'), ', by the entity ', caller_name, ' who logged in using the IP address ', caller_ip_address, '.\n<br />It is recommended to confirm the above activity.'), severity = 'High'
        ;
        let rule_failed_to_run_monthly_rates =
        SentinelHealth
            | where TimeGenerated > ago(lookback_time)
            | where SentinelResourceType == 'Analytics Rule'
            | where OperationName endswith "rule run"
            | summarize
                MonthlyRuleExecutions = todouble(count()),
                MonthlyRuleUnsuccessfulExecutions = todouble(countif(Status == 'Failure')),
                MonthlyRuleSuccessfulExecutions = todouble(countif(Status == 'Success')),
                make_set(Status, 5),
                FailuresDescription = make_set_if(Description, Status == 'Failure', 10),
                FailuresReason = make_set_if(Reason, Status == 'Failure', 20)
                by SentinelResourceName, RuleId = tostring(ExtendedProperties.RuleId)
            | extend monthly_success_rate = round((100.0 * (MonthlyRuleSuccessfulExecutions / MonthlyRuleExecutions)), 2),
                    monthly_failure_rate = round((100.0 * (MonthlyRuleUnsuccessfulExecutions / MonthlyRuleExecutions)), 2)
            | project-reorder SentinelResourceName, monthly_success_rate, monthly_failure_rate, RuleId
            | where monthly_failure_rate >= monthly_failures_ratio_threshold
            | extend work_item_title = strcat('⚠️ Monthly Rule Failure Ratio Reached [RuleId: ', RuleId, ']'), work_item_description = strcat('The analytics rule ', SentinelResourceName, ' exceeded the montly failure threshold for the period ', format_datetime(ago(30d), "MM-dd-yyyy"), ' to ', format_datetime(now(), "MM-dd-yyyy"), '.\n<br />\n<br />Monthly Failure Rate: ', monthly_failure_rate, '\n<br />Monthly Success Rate: ', monthly_success_rate, '\n<br />Monthly Rule Executions: ', MonthlyRuleExecutions, '\n<br />Monthly Rule Successful Executions: ', MonthlyRuleSuccessfulExecutions, '\n<br />Monthly Rule Failed Executions: ', MonthlyRuleUnsuccessfulExecutions,
                    '\n<br />\n<br />It is recommended to investigate the execution errors and tune the rule query.'), severity = 'Low'
        ;
        let rule_failed_to_run_daily_rates =
        SentinelHealth
            | where TimeGenerated > ago(lookback_time)
            | where SentinelResourceType == 'Analytics Rule'
            | where OperationName endswith "rule run"
            | summarize
                DailyRuleExecutions = todouble(count()),
                DailyRuleUnsuccessfulExecutions = todouble(countif(Status == 'Failure')),
                DailyRuleSuccessfulExecutions = todouble(countif(Status == 'Success')),
                make_set(Status, 5),
                FailuresDescription = make_set_if(Description, Status == 'Failure', 10),
                FailuresReason = make_set_if(Reason, Status == 'Failure', 20)
                by SentinelResourceName, RuleId = tostring(ExtendedProperties.RuleId), bin(TimeGenerated, 1d)
            | extend daily_success_rate = round((100.0 * (DailyRuleSuccessfulExecutions / DailyRuleExecutions)), 2),
                    daily_failure_rate = round((100.0 * (DailyRuleUnsuccessfulExecutions / DailyRuleExecutions)), 2)
            | project-reorder SentinelResourceName, daily_success_rate, daily_failure_rate, RuleId
            | where daily_failure_rate > daily_failures_ratio_threshold
            | extend work_item_title = strcat('⚠️ Daily Rule Failure Ratio Reached [RuleId: ', RuleId, ']'), work_item_description = strcat('The analytics rule ', SentinelResourceName, ' exceeded the daily failure threshold on ', format_datetime(TimeGenerated, 'MM-dd-yyyy'), '.\n<br />\n<br />Daily Failure Rate: ', daily_failure_rate, '\n<br />Daily Success Rate: ', daily_success_rate, '\n<br />Daily Rule Executions: ', DailyRuleExecutions, '\n<br />Daily Rule Successful Executions: ', DailyRuleSuccessfulExecutions, '\n<br />Daily Rule Failed Executions: ', DailyRuleUnsuccessfulExecutions,
            '\n<br />\n<br />It is recommended to investigate the execution errors and tune the rule query.'), severity = 'Medium'
        ;
        union rule_auto_disabled_results, rule_deleted_results, rule_failed_to_run_monthly_rates, rule_failed_to_run_daily_rates, rule_disabled_results
        | project-reorder work_item_title, work_item_description, severity

jobs:
- job: DetectionMonitoring
  displayName: "Detection Monitoring"
  steps:
    - checkout: self
      path: 's/$(Build.Repository.Name)'
    - script: |
        pip install -r $(Pipeline.Workspace)/s/$(Build.Repository.Name)/pipelines/scripts/requirements.txt
      displayName: 'Python Dependencies Installation'
    - bash: |
        python $(Pipeline.Workspace)/s/$(Build.Repository.Name)/pipelines/scripts/detection_monitoring.py --tenant 'QA' --platform 'sentinel' --template 'trigger_rate.jinja' --detection-compare-field 'RelatedAnalyticRuleId'
      env:
        QUERY: $(kql_query)
      displayName: Detection Trigger and Entities Rate Run
    - bash: |
        python $(Pipeline.Workspace)/s/$(Build.Repository.Name)/pipelines/scripts/detection_monitoring.py --tenant 'QA' --platform 'sentinel' --template 'detection_performance.jinja' --detection-compare-field 'RuleId'
      env:
        QUERY: $(kql_query2)
      displayName: Detection Performance Monitoring Run
    - publish: $(Pipeline.Workspace)/s/$(Build.Repository.Name)/pipelines/results
      artifact: Detection Monitoring
      displayName: Publish Detection Trigger Rate Results as Artifacts
    - task: CreateWorkItem@2
      displayName: 'Create or Update Work Items for Detection Trigger Rates'
      inputs:
        bulkMode: true
        bulkConfigData: $(trigger_rate)
      condition: eq('${{ parameters.create_work_items }}', true)
    - task: CreateWorkItem@2
      displayName: 'Create or Update Work Items for Detection Performance Monitoring Issues'
      inputs:
        bulkMode: true
        bulkConfigData: $(detection_performance)
      condition: eq('${{ parameters.create_work_items }}', true)
YAML
Execution Example
We will execute the pipeline with a lookback value of 30 days, looking for rules with more 400 incidents generated and show either over 20% monthly execution failures per month or more than 70% execution failures per day. We also opt in to create work items for the results of the pipeline and click on Run.

The pipeline is being executed succesfully.

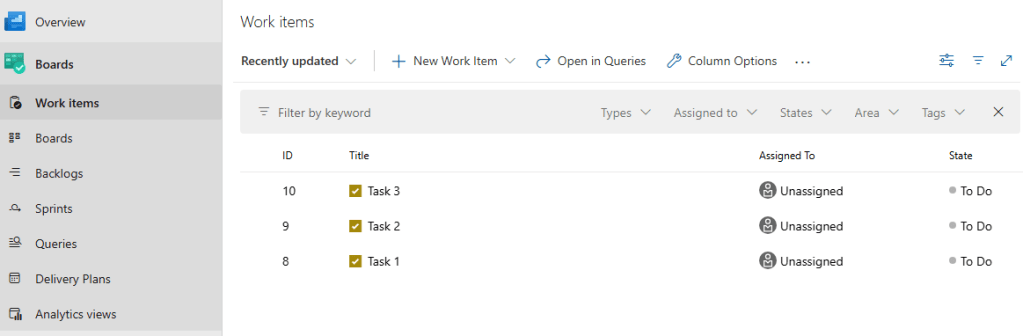
We then navigate to Azure Boards -> Work Items and we can see that work items have been created for the noisy rules or the rules where tampering or performance issues where identified.


Wrapping Up
In this part, we went through the often overlooked monitoring and maintenance aspects of detection engineering, which are crucial for preventing alert blowouts and ensuring that our detections remain effective. We implemented an automation in Azure DevOpS to monitor detection trigger rates, entity appearances, detection tampering and detection performance issues. Additionally, we automated the work item creation in Azure DevOps Boards for problematic detections that were identified.
In the next part we are going to explore how we can use Continuous Deployment pipelines to tune our detections.
References
[1] https://medium.com/falconforce/why-is-no-one-talking-about-maintenance-in-detection-engineering-ebb5820564dc
[2] https://learn.microsoft.com/en-us/azure/devops/boards/work-items/about-work-items?view=azure-devops&tabs=agile-process
[3] https://learn.microsoft.com/en-us/azure/azure-monitor/logs/manage-access?tabs=portal
[4] https://learn.microsoft.com/en-us/azure/azure-monitor/logs/api/access-api
[5] https://learn.microsoft.com/en-us/azure/sentinel/enable-monitoring?tabs=defender-portal
[6] https://marketplace.visualstudio.com/items?itemName=mspremier.CreateWorkItem
[7] https://jinja.palletsprojects.com/en/stable/intro/
About the Authors

Christos Giampoulakis
Christos is a member of NVISO’s CSIRT & SOC Threat Detection Engineering team, where he focuses on researching and developing detection Use Cases.

Stamatis Chatzimangou
Stamatis is a member of the Threat Detection Engineering team at NVISO’s CSIRT & SOC and is mainly involved in Use Case research and development.
如有侵权请联系:admin#unsafe.sh