Linux monitoring tools are essential for maintaining system reliability, performance, and security in modern infrastructure environments. From lightweight real-time monitors to comprehensive enterprise platforms, the landscape of Linux monitoring tools offers solutions for every use case and organisation size. Understanding the strengths, limitations, and ideal applications of different Linux monitoring tools enables informed decisions for your infrastructure observability strategy.
This comprehensive guide examines all major Linux monitoring tools available in 2025, categorised by functionality, deployment complexity, and ideal use cases. Whether you’re monitoring a single server, managing containerised applications, or overseeing enterprise-scale distributed systems, this guide helps you select the optimal Linux monitoring tools for your requirements.
🔄 The Modern Linux Monitoring Tools Ecosystem
| Evolution Stage | 📅 Era | 🛠️ Tool Types | 📊 Focus Areas | 🔧 Key Technologies |
| Legacy | 2000-2010 | 📟 Simple uptime checks | ⚠️ Basic alerting | SNMP, ping, basic scripts |
| Traditional | 2010-2018 | 🖥️ Comprehensive platforms | 📈 System metrics | Web interfaces, databases |
| Cloud-Native | 2018-2023 | ☁️ Distributed systems | 📦 Container monitoring | Time-series, APIs, K8s |
| Observability | 2023-2025 | 🤖 AI-powered platforms | 🔍 Full-stack visibility | ML, OpenTelemetry, edge |
Contemporary Linux monitoring tools must address cloud-native architectures, microservices complexity, container orchestration, and multi-cloud deployments. Auto-discovery, dynamic configuration, and API-driven management have become standard requirements rather than advanced features.
The integration between monitoring tools and remote administration platforms creates powerful automation workflows. Linux monitoring tools now serve as data sources for automated remediation, capacity planning, and performance optimisation systems.
🏆 Comprehensive Linux Monitoring Tools Comparison
🎯 Enterprise-Grade Monitoring Platforms
| Tool | 🏷️ Type | 🚀 Deployment | 📚 Learning Curve | 🎖️ Best For | 💰 Cost | 🌐 Website |
| 🔥 Prometheus | Time-series DB | Self-hosted | 🟡 Moderate-High | ☁️ Cloud-native, metrics | Free | prometheus.io |
| ⚡ Zabbix | All-in-one platform | Self-hosted | 🟡 Moderate | 🏢 Traditional + modern | Free/Paid | zabbix.com |
| 📊 Grafana | Visualisation platform | Self-hosted/Cloud | 🟢 Low-Moderate | 📈 Dashboards, analytics | Free/Paid | grafana.com |
| 🔍 Elastic Stack | Log analytics | Self-hosted/Cloud | 🟡 Moderate-High | 📝 Log analysis, search | Free/Paid | elastic.co |
| 🐕 Datadog | Commercial SaaS | Cloud-only | 🟢 Low | 🌟 Full-stack observability | $$$ | datadoghq.com |
| 📱 New Relic | APM Platform | Cloud-only | 🟢 Low | 🚀 Application performance | $$$ | newrelic.com |
| 🤖 Dynatrace | AI Platform | SaaS/On-prem | 🟢 Low-Moderate | 🧠 AI-powered insights | $$$$ | dynatrace.com |
🪶 Lightweight and Specialised Tools
| Tool | 🎯 Focus Area | ⚡ Resource Usage | 🔧 Setup Complexity | 🏠 Ideal Environment | 🌐 Website |
| 📊 Netdata | Real-time monitoring | 🟢 Very Low | 🟢 Minimal | 💻 Development, small teams | netdata.cloud |
| 👁️ Nagios | Infrastructure monitoring | 🟢 Low | 🟡 Moderate | 🏢 Traditional networks | nagios.org |
| ❄️ Icinga | Network monitoring | 🟢 Low | 🟡 Moderate | 🏢 Enterprise networks | icinga.com |
| 🌐 LibreNMS | Network device monitoring | 🟢 Low | 🟡 Low-Moderate | 🔌 Network-focused | librenms.org |
| 🐼 Pandora FMS | Comprehensive monitoring | 🟡 Moderate | 🟡 Moderate | 🏢 Mixed environments | pandorafms.org |
| 👀 Glances | Terminal monitoring | 🟢 Very Low | 🟢 Minimal | 💻 Quick diagnostics | nicolargo.github.io/glances |
| 📡 PRTG | Windows + Linux | 🟡 Moderate | 🟢 Low | 🏢 Windows-centric orgs | paessler.com/prtg |
📈 Time-Series and Metrics-Focused Linux Monitoring Tools
🔥 Prometheus: Cloud-Native Standard
| Feature Category | 🔥 Prometheus Capability | 📊 Rating | 💡 Details |
| ☁️ Cloud Integration | Kubernetes, Docker, service discovery | ⭐⭐⭐⭐⭐ | Native K8s integration, auto-discovery |
| 📊 Query Language | PromQL with advanced functions | ⭐⭐⭐⭐⭐ | Powerful time-series queries |
| 🔌 Ecosystem | 800+ exporters and integrations | ⭐⭐⭐⭐⭐ | Largest monitoring ecosystem |
| 📈 Scalability | Horizontal federation support | ⭐⭐⭐⭐ | Good with proper architecture |
| 💰 Cost | Open source, operational overhead | ⭐⭐⭐⭐ | Free but requires expertise |
| 🎯 Ease of Use | Complex setup, powerful features | ⭐⭐⭐ | Steep learning curve |
Prometheus dominates cloud-native monitoring with its pull-based architecture and powerful query language. The Prometheus ecosystem includes AlertManager for notifications, numerous exporters for data collection, and tight integration with orchestration platforms.
🚀 Strengths:
- ✅ Excellent Kubernetes and Docker integration
- ✅ Powerful PromQL query language
- ✅ Large ecosystem of exporters
- ✅ Built-in time-series database
- ✅ Service discovery automation
⚠️ Limitations:
- ❌ No built-in dashboards (requires Grafana)
- ❌ Limited long-term storage options
- ❌ Complex multi-component architecture
- ❌ Steep learning curve for PromQL

Image Reference: From this awesome guide Learn “Prometheus Architecture: A Complete Guide”
https://devopscube.com/prometheus-architecture/
📊 InfluxDB: Purpose-Built Time-Series
| Component | 🔧 Function | 💪 Strengths | ⚠️ Considerations |
| 📊 InfluxDB | Time-series database | High performance, SQL-like queries | Commercial licensing |
| 📡 Telegraf | Data collection agent | 200+ plugins, easy configuration | Resource usage at scale |
| 📈 Chronograf | Visualisation interface | Built-in dashboards, alerting | Limited compared to Grafana |
| ⚡ Kapacitor | Stream processing | Real-time analytics, alerting | Complex configuration |
InfluxDB offers a complete time-series platform with built-in dashboards, alerting, and data processing capabilities. The TICK stack provides comprehensive monitoring functionality for Linux monitoring tools implementations.
🚄 VictoriaMetrics: High-Performance Alternative
| Metric | 🔥 Prometheus | 🚄 VictoriaMetrics | 🏆 Winner |
| 💾 Storage Efficiency | Standard compression | 10x better compression | 🚄 VictoriaMetrics |
| ⚡ Query Performance | Good performance | 5x faster queries | 🚄 VictoriaMetrics |
| 🔧 Setup Complexity | Multiple components | Single binary | 🚄 VictoriaMetrics |
| 🌍 Ecosystem | Huge ecosystem | Prometheus-compatible | 🔥 Prometheus |
| 📚 Documentation | Extensive docs | Growing documentation | 🔥 Prometheus |
VictoriaMetrics provides Prometheus-compatible monitoring with enhanced performance and storage efficiency. This tool excels in high-cardinality environments requiring long-term data retention.
🏢 All-in-One Linux Monitoring Tools
⚡ Zabbix: Comprehensive Enterprise Solution
| Feature Category | ⚡ Zabbix Capability | 📊 Rating | 🔧 Implementation Level |
| 🖥️ System Monitoring | CPU, memory, disk, network | ⭐⭐⭐⭐⭐ | Out-of-the-box templates |
| 🌐 Network Monitoring | SNMP, network discovery | ⭐⭐⭐⭐⭐ | 300+ device templates |
| 🌍 Web Monitoring | HTTP scenarios, SSL checks | ⭐⭐⭐⭐ | Built-in web scenarios |
| 📱 Mobile Support | iOS/Android apps | ⭐⭐⭐ | Native mobile apps |
| 📊 Reporting | SLA, trending, capacity | ⭐⭐⭐⭐⭐ | Comprehensive reporting |
| 🔄 Auto-discovery | Network, services, containers | ⭐⭐⭐⭐ | Template-based discovery |
Zabbix provides complete monitoring functionality in a single platform. From system metrics to network monitoring, web scenario testing, and log analysis, Zabbix covers comprehensive monitoring requirements.
🐼 Pandora FMS: Flexible Monitoring Platform
| Monitoring Type | 🐼 Pandora FMS Support | 🔧 Configuration | 💰 Licensing |
| 🖥️ System Monitoring | ✅ Full support | 🟢 Templates available | Free/Commercial |
| 🌐 Network Monitoring | ✅ SNMP + custom | 🟡 Moderate setup | Free/Commercial |
| 📱 Application Monitoring | ✅ Custom plugins | 🟡 Requires development | Commercial |
| ☁️ Cloud Monitoring | ✅ API integrations | 🔴 Complex setup | Commercial |
| 📊 Log Analysis | ✅ Built-in processing | 🟡 Configuration needed | Commercial |
Pandora FMS offers comprehensive monitoring with network discovery, application monitoring, and log analysis. The platform supports both open-source and commercial editions with extensive customisation options.
📊 Visualisation and Dashboard Linux Monitoring Tools
📊 Grafana: Universal Dashboard Platform
| Data Source Category | 🔌 Supported Sources | 📊 Integration Quality | 🔧 Setup Complexity |
| 📈 Time-Series | Prometheus, InfluxDB, VictoriaMetrics | ⭐⭐⭐⭐⭐ | 🟢 Native support |
| 📝 Logs | Loki, Elasticsearch, Splunk | ⭐⭐⭐⭐ | 🟡 Configuration required |
| 🔍 Tracing | Jaeger, Zipkin, Tempo | ⭐⭐⭐⭐ | 🟡 Setup needed |
| 💾 Databases | MySQL, PostgreSQL, MongoDB | ⭐⭐⭐⭐ | 🟢 Direct queries |
| ☁️ Cloud Services | AWS, Azure, GCP metrics | ⭐⭐⭐⭐⭐ | 🟢 Native plugins |
| 🏢 Enterprise Tools | Zabbix, Nagios, PRTG | ⭐⭐⭐ | 🟡 Custom configurations |
Grafana serves as the de facto standard for monitoring visualisation. Supporting multiple data sources, Grafana creates unified dashboards across different monitoring systems.
🔍 Kibana: Log-Centric Visualisation
| Analysis Type | 🔍 Kibana Capability | 🎯 Use Case | 📊 Effectiveness |
| 📝 Log Analysis | Advanced search, aggregations | Troubleshooting, compliance | ⭐⭐⭐⭐⭐ |
| 🗺️ Geographic Data | Maps, location analytics | Network monitoring, security | ⭐⭐⭐⭐ |
| 📊 Metrics Visualisation | Basic charts, dashboards | Simple metrics display | ⭐⭐⭐ |
| 🤖 Machine Learning | Anomaly detection, forecasting | Predictive analysis | ⭐⭐⭐⭐ |
| 🛡️ Security Analytics | SIEM capabilities, alerting | Security monitoring | ⭐⭐⭐⭐⭐ |
Kibana excels at log data visualisation and analysis as part of the Elastic Stack. While primarily log-focused, Kibana handles metrics and other data types effectively.
⚡ Real-Time and Lightweight Linux Monitoring Tools
📊 Netdata: Instant System Insights
| Performance Metric | 📊 Netdata Capability | ⏱️ Update Frequency | 🎯 Accuracy Level |
| 🖥️ CPU Monitoring | Per-core, per-process metrics | 1 second | ⭐⭐⭐⭐⭐ |
| 💾 Memory Analysis | RAM, swap, buffers, cache | 1 second | ⭐⭐⭐⭐⭐ |
| 💿 Disk Performance | IOPS, latency, utilisation | 1 second | ⭐⭐⭐⭐⭐ |
| 🌐 Network Traffic | Bandwidth, packets, errors | 1 second | ⭐⭐⭐⭐⭐ |
| 🤖 ML Anomaly Detection | Automatic baseline learning | Real-time | ⭐⭐⭐⭐ |
| 🔋 Resource Usage | Minimal CPU/RAM impact | Continuous | ⭐⭐⭐⭐⭐ |
Netdata provides real-time system monitoring with minimal setup and resource usage. The tool offers per-second metrics with automatic anomaly detection and zero-configuration deployment.
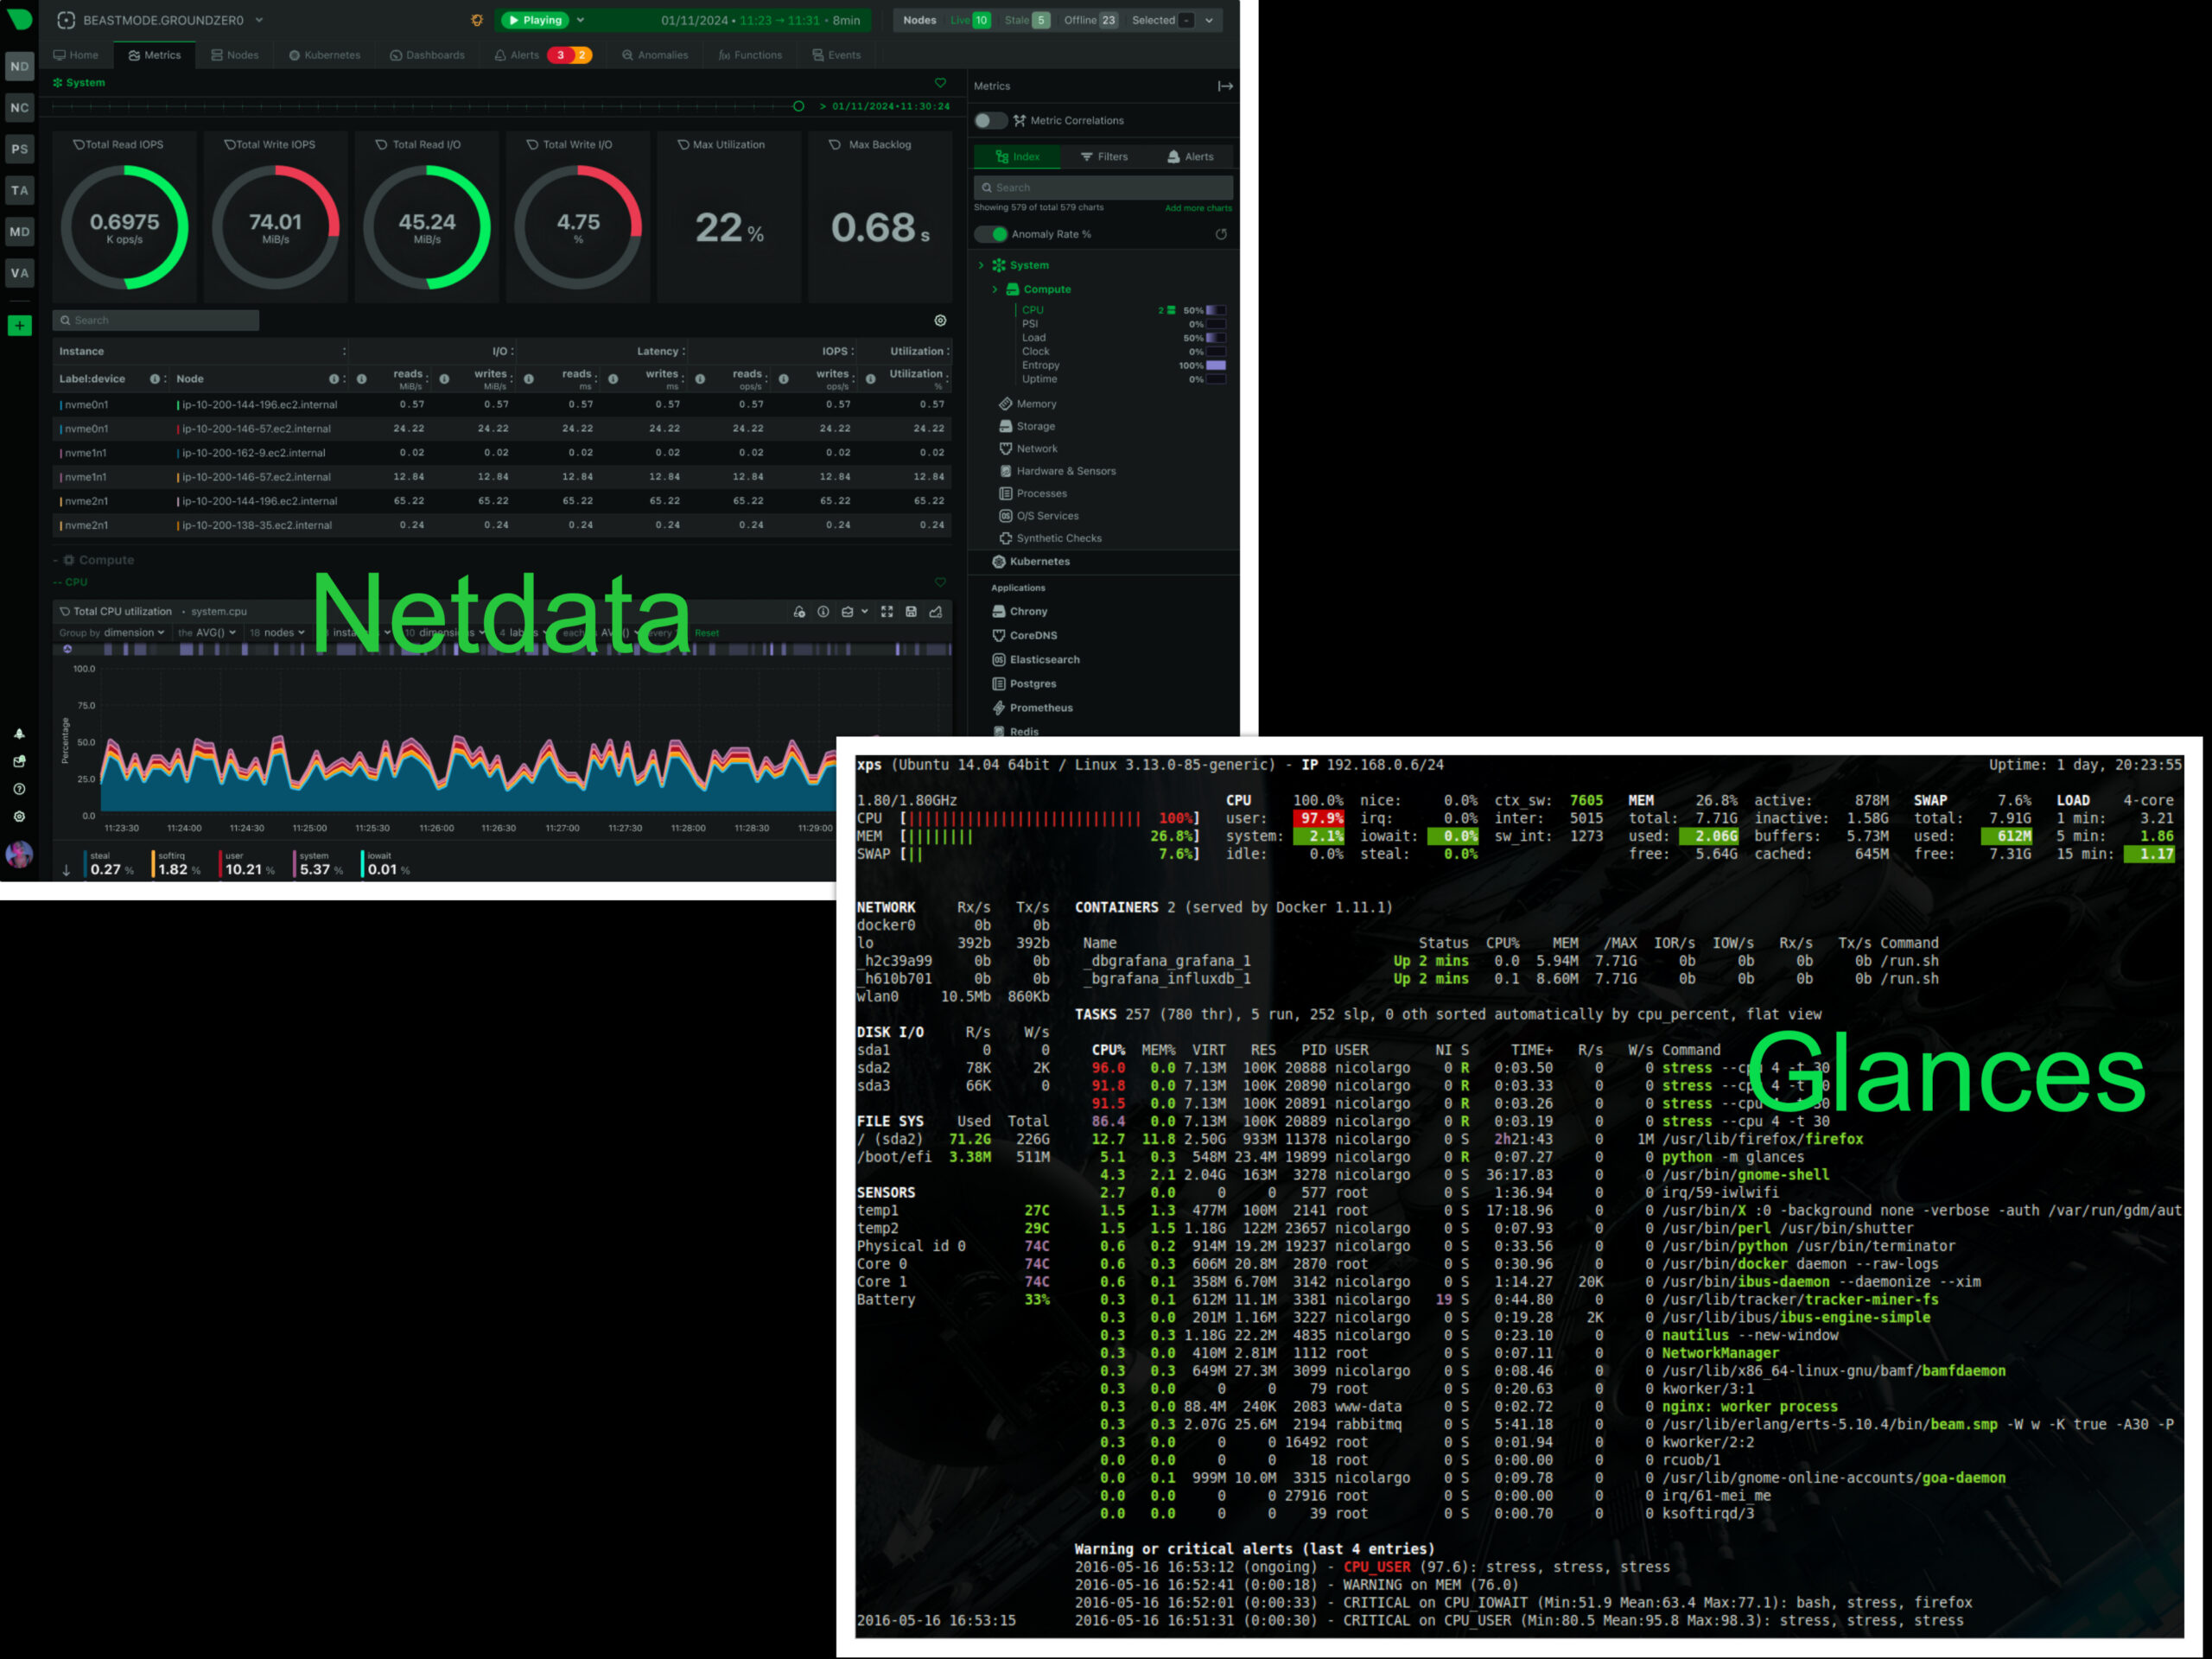
👀 Glances: Terminal-Based Monitoring
| Display Mode | 👀 Glances Feature | 🖥️ Interface Type | 🔧 Use Case |
| 💻 Terminal | Curses-based interface | Text-based | SSH sessions, minimal resources |
| 🌐 Web | HTML dashboard | Browser-based | Remote monitoring |
| 📱 API | REST endpoints | Programmatic | Integration with other tools |
| 📊 CSV Export | Data export capability | File-based | Historical analysis |
| ⚠️ Alerting | Basic threshold alerts | Email/script | Simple notifications |
Glances offers comprehensive system monitoring through terminal interfaces and web dashboards. This lightweight tool provides quick system overviews without complex setup requirements.
🏛️ Traditional and Network-Focused Linux Monitoring Tools
👁️ Nagios: The Monitoring Pioneer
| Component | 👁️ Nagios Feature | 🔧 Configuration | 💡 Modern Relevance |
| 🔌 Plugin System | 5000+ community plugins | Manual config files | ⭐⭐⭐⭐ Still valuable |
| ⚠️ Alerting | Flexible notification system | Text-based config | ⭐⭐⭐ Reliable but dated |
| 📊 Web Interface | Basic status displays | CGI-based | ⭐⭐ Functional but old |
| 📈 Reporting | Historical data, trends | Add-on required | ⭐⭐ Limited capabilities |
| 🔄 Scalability | Distributed monitoring | Manual setup | ⭐⭐ Requires significant effort |
Nagios remains relevant for traditional infrastructure monitoring. Nagios Core provides open-source monitoring, while Nagios XI offers commercial features.
❄️ Icinga: Modern Nagios Alternative
| Improvement Area | ❄️ Icinga Advantage | 👁️ vs Nagios | 📊 Impact |
| 🖥️ Web Interface | Modern responsive design | Significant upgrade | ⭐⭐⭐⭐ |
| 📊 API Integration | RESTful API support | Major improvement | ⭐⭐⭐⭐⭐ |
| 📈 Scalability | Better distributed monitoring | Moderate improvement | ⭐⭐⭐⭐ |
| 🔧 Configuration | Improved config management | Some improvement | ⭐⭐⭐ |
| 📱 Mobile Support | Native mobile interface | New capability | ⭐⭐⭐⭐ |
Icinga modernises traditional monitoring with improved interfaces and enhanced functionality. Built on Nagios foundations, Icinga offers better usability and modern features.
🌐 LibreNMS: Network-Focused Excellence
| Network Feature | 🌐 LibreNMS Capability | 🔧 Setup Required | 🎯 Effectiveness |
| 🔍 Auto-Discovery | SNMP-based device discovery | 🟢 Minimal | ⭐⭐⭐⭐⭐ |
| 📊 Device Support | 1000+ device types | 🟢 Templates included | ⭐⭐⭐⭐⭐ |
| 🗺️ Network Maps | Topology visualisation | 🟡 Some configuration | ⭐⭐⭐⭐ |
| ⚠️ Alerting | Rule-based notifications | 🟡 Configuration needed | ⭐⭐⭐⭐ |
| 📈 Performance | Bandwidth, error monitoring | 🟢 Automatic | ⭐⭐⭐⭐⭐ |
LibreNMS specialises in network device monitoring with automatic discovery and comprehensive SNMP support. The platform excels at managing large network infrastructures.
☁️ Cloud-Native and Container Linux Monitoring Tools
📦 Container-Specific Solutions
| Tool | 🎯 Primary Focus | 🔌 Integration | 🏆 Complexity | 📊 Effectiveness | 🌐 Website |
| 👁️ cAdvisor | 📦 Container metrics | Docker/K8s | 🟢 Low | ⭐⭐⭐⭐ | github.com/google/cadvisor |
| 🕸️ Weave Scope | 🗺️ Container topology | Kubernetes | 🟢 Low | ⭐⭐⭐⭐ | github.com/weaveworks/scope |
| 🛡️ Falco | 🔒 Runtime security | Kubernetes | 🟡 Moderate | ⭐⭐⭐⭐⭐ | falco.org |
| 🔍 Jaeger | 🌐 Distributed tracing | Microservices | 🟡 Moderate | ⭐⭐⭐⭐⭐ | jaegertracing.io |
| 🔗 Linkerd | 🕸️ Service mesh observability | Kubernetes | 🟡 Moderate | ⭐⭐⭐⭐ | linkerd.io |
| 🌟 Istio | 🕸️ Service mesh platform | Kubernetes | 🔴 High | ⭐⭐⭐⭐⭐ | istio.io |
☸️ Kubernetes-Native Monitoring
| Component | 🔧 Function | 📊 Maturity | 🎯 Use Case | 🌐 Official Link |
| 📊 Metrics Server | Basic resource metrics | ⭐⭐⭐⭐⭐ | HPA, resource monitoring | k8s.io |
| 🔥 Prometheus Operator | Automated Prometheus | ⭐⭐⭐⭐⭐ | Production K8s monitoring | prometheus-operator.dev |
| 📊 Grafana Operator | Dashboard management | ⭐⭐⭐⭐ | Automated dashboards | grafana.com |
| 🔔 AlertManager | Kubernetes-aware alerting | ⭐⭐⭐⭐⭐ | Cluster notifications | prometheus.io |
| 🔍 Jaeger Operator | Distributed tracing | ⭐⭐⭐⭐ | Microservices observability | jaegertracing.io |
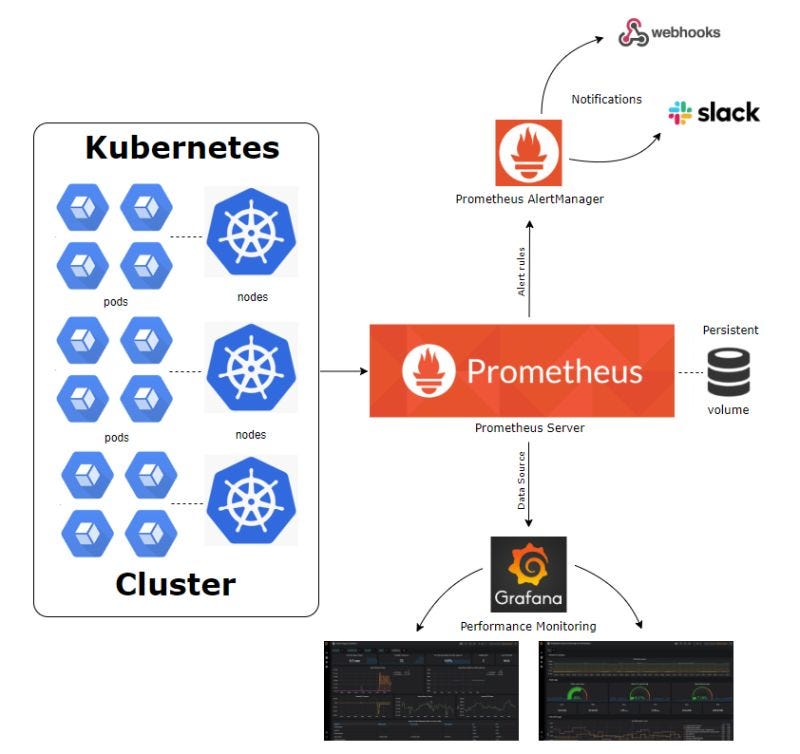
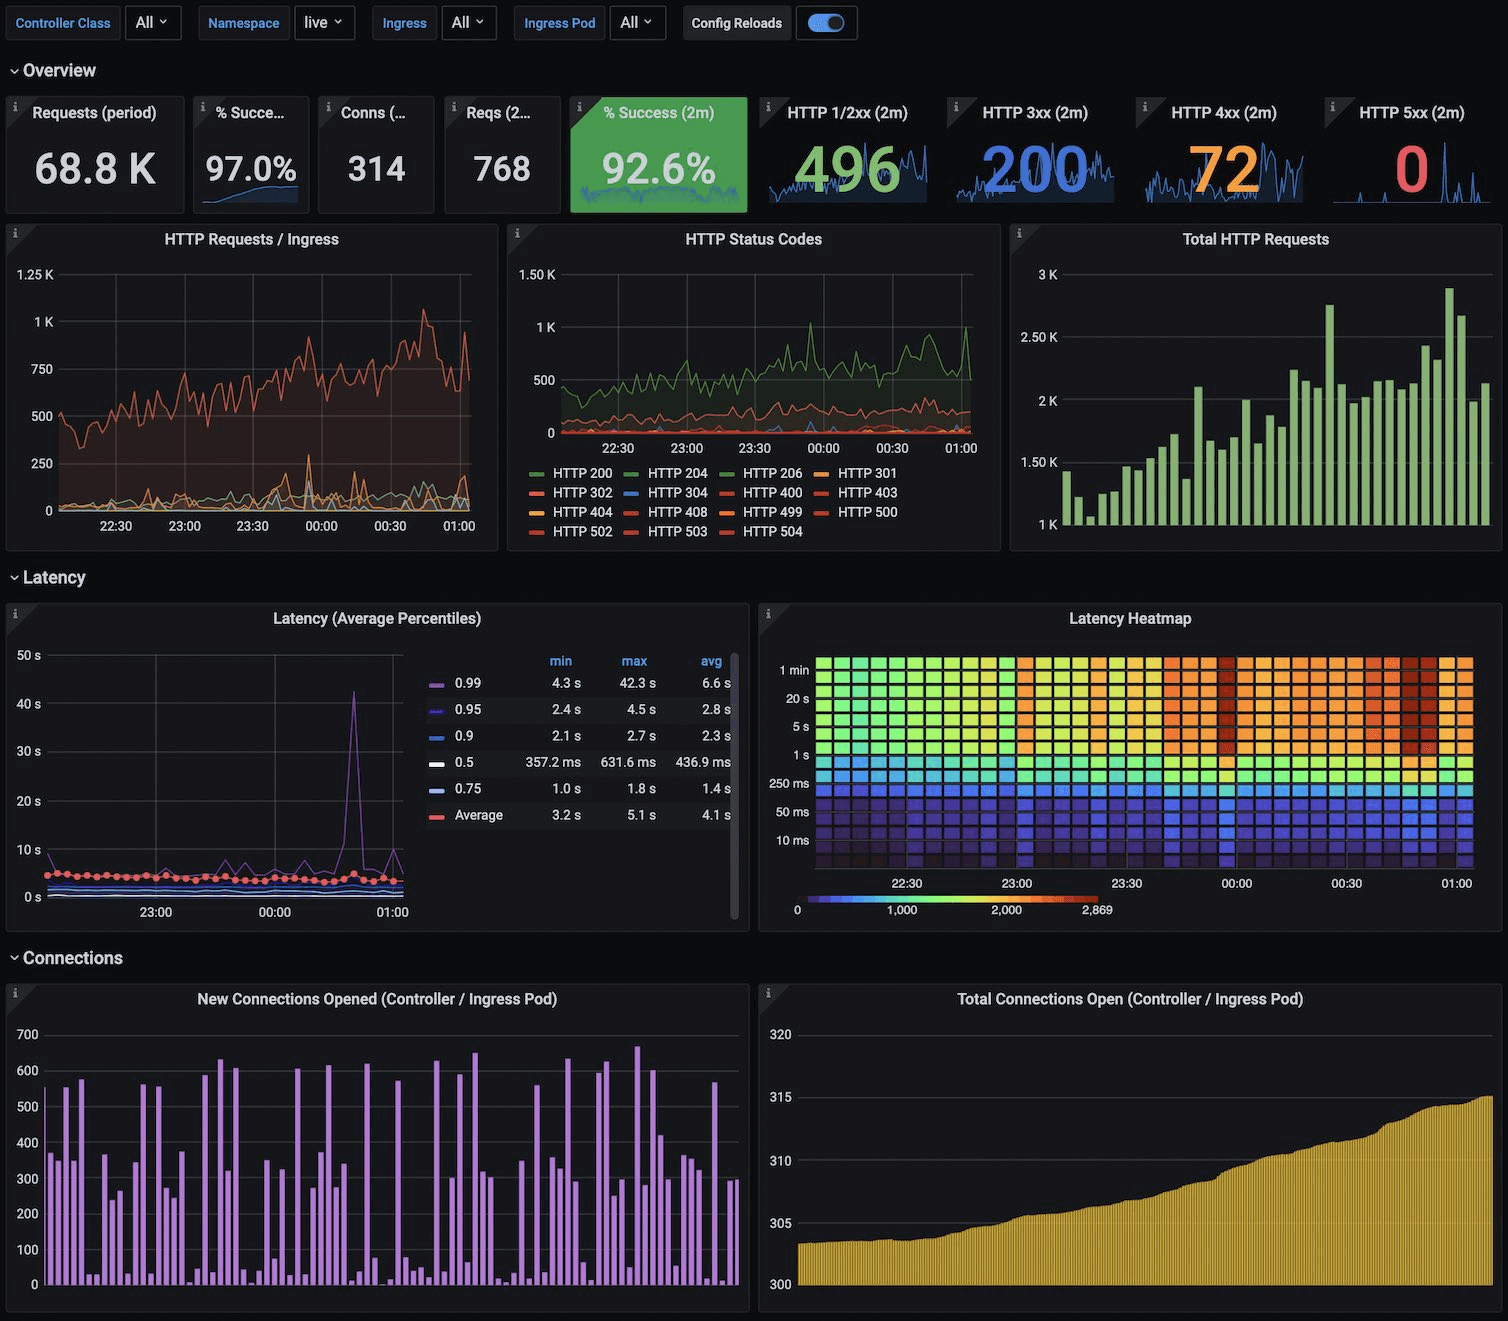
Image Courtesy: More here https://aws.plainenglish.io/kubernetes-monitoring-a-pathway-to-prometheus-and-grafana-58b38bd120fe
💼 Commercial and Enterprise Linux Monitoring Tools
🌟 Full-Stack Observability Platforms
| Platform | 🎯 Core Strength | 💰 Pricing Model | 🔧 Deployment | 📊 Feature Completeness | 🌐 Website |
| 🐕 Datadog | 📊 Metrics + APM | Per-host + features | ☁️ SaaS only | ⭐⭐⭐⭐⭐ | datadoghq.com |
| 📱 New Relic | 🚀 Application monitoring | Data ingestion | ☁️ SaaS only | ⭐⭐⭐⭐⭐ | newrelic.com |
| 🤖 Dynatrace | 🧠 AI-powered insights | Per-host | ☁️ SaaS/On-prem | ⭐⭐⭐⭐⭐ | dynatrace.com |
| 🔍 Splunk | 📊 Data analytics | Data volume | 🏢 On-prem/Cloud | ⭐⭐⭐⭐⭐ | splunk.com |
| 🚀 AppDynamics | 📱 Application focus | Per-agent | 🏢 SaaS/On-prem | ⭐⭐⭐⭐ | appdynamics.com |
| 🛡️ SolarWinds | 🌐 Network + infrastructure | Per-element | 🏢 On-prem | ⭐⭐⭐⭐ | solarwinds.com |
💰 Cost Analysis: Commercial vs Open Source
| Cost Factor | 💸 Commercial Tools | 🆓 Open Source Tools | 📊 Impact Level |
| 💳 Licensing | $50-500+ per host/month | $0 | 🔴 High |
| 👨💼 Personnel | Lower ops overhead | Higher expertise needed | 🟡 Medium |
| 🏗️ Infrastructure | Vendor-managed | Self-managed | 🟡 Medium |
| 📚 Training | Vendor-provided | Community/self-taught | 🟡 Medium |
| 🔒 Support | Professional SLAs | Community-based | 🟡 Medium |
| 📈 Scalability | Vendor-managed | Manual scaling | 🟡 Medium |
🎯 Linux Monitoring Tools Selection by Use Case
💻 Development and Testing Environments
| Priority | 🎯 Requirement | 🛠️ Recommended Tools | 💡 Justification | 🔧 Setup Time |
| 1 | 📊 Real-time feedback | 📊 Netdata, 👀 Glances | Instant system visibility | 5 minutes |
| 2 | 📦 Container monitoring | 👁️ cAdvisor, 📊 Docker stats | Development workflow integration | 15 minutes |
| 3 | 📝 Log debugging | 📊 Grafana Loki, local ELK | Troubleshooting capability | 1 hour |
| 4 | 📈 Performance testing | 📊 Grafana + 🔥 Prometheus | Load testing visualisation | 2 hours |
| 5 | 🔄 CI/CD integration | 📊 Prometheus metrics | Build pipeline monitoring | 4 hours |
🏢 Small to Medium Business
| Component | 🏆 Primary Choice | 🔄 Alternative | 🎯 Purpose | 💰 Cost Impact |
| 📊 Core Monitoring | ⚡ Zabbix | 🔥 Prometheus + 📊 Grafana | System and network monitoring | 🟢 Low |
| 📈 Visualisation | 📊 Grafana | ⚡ Zabbix built-in | Enhanced dashboards | 🟢 Low |
| ⚡ Real-time Insights | 📊 Netdata | 👀 Glances | Development and troubleshooting | 🟢 Low |
| 🌐 Network Devices | 🌐 LibreNMS | ⚡ Zabbix SNMP | Network infrastructure | 🟢 Low |
| 📝 Log Management | 📊 Grafana Loki | 🔍 ELK Stack | Centralised logging | 🟡 Medium |
🎯 Benefits:
- ✅ Integrated functionality reduces complexity
- ✅ Lower operational overhead
- ✅ Cost-effective open-source solutions
- ✅ Scalable architecture for growth
🏢 Enterprise Environments
| Layer | 🏆 Primary Tool | 🔄 Secondary Tool | 🎯 Purpose | 💰 Investment Level |
| 📊 Metrics | 🔥 Prometheus + 📊 Grafana | ⚡ Zabbix | Infrastructure metrics, dashboards | 🔴 High |
| 📝 Logs | 🔍 Elastic Stack | 📊 Grafana Loki | Log aggregation, analysis | 🔴 High |
| 🔍 Tracing | 🔍 Jaeger/Zipkin | 🤖 Dynatrace | Distributed application tracing | 🟡 Medium |
| 📱 APM | 🐕 Datadog/📱 New Relic | 🔥 Prometheus APM | Application performance | 🔴 High |
| 🛡️ Security | 🔍 Splunk/🛡️ SolarWinds | 🛡️ Falco + Grafana | Security monitoring, compliance | 🔴 High |
| 🌐 Networks | 🌐 LibreNMS/🛡️ SolarWinds | ⚡ Zabbix | Network device monitoring | 🟡 Medium |
🏢 Enterprise Considerations:
- ✅ Multi-tool integration requirements
- ✅ Compliance and audit capabilities
- ✅ High availability and disaster recovery
- ✅ Professional support and training
- ✅ Centralised management and governance
☁️ Cloud-Specific Linux Monitoring Tools
🟠 AWS Monitoring Integration
| Service | 🎯 Purpose | 🔌 Integration Level | 💰 Cost Model | 📊 Effectiveness |
| ☁️ CloudWatch | 📊 Metrics and logs | 🟢 Native AWS | 💰 Usage-based | ⭐⭐⭐⭐ |
| 🔍 X-Ray | 🌐 Distributed tracing | 📱 Application level | 💰 Request-based | ⭐⭐⭐⭐ |
| 🛠️ Systems Manager | 🏗️ Fleet management | 🖥️ Instance level | 💰 Per-action | ⭐⭐⭐ |
| 📦 Container Insights | 📦 EKS/ECS monitoring | 📦 Container level | 💰 Per-container | ⭐⭐⭐⭐ |
| 📱 Application Insights | 📱 Application monitoring | 📱 Code level | 💰 Data volume | ⭐⭐⭐⭐ |
🔵 Azure Monitoring Solutions
🟢 Google Cloud Monitoring
| Service | 🎯 Function | 💪 Strength | 🔧 Setup Complexity | 💰 Pricing |
| ☁️ Cloud Monitoring | 📊 Infrastructure metrics | GCP integration | 🟢 Low | Usage-based |
| 📝 Cloud Logging | 📝 Log management | Structured logging | 🟢 Low | Volume-based |
| 🔍 Cloud Trace | 🌐 Application tracing | Performance insights | 🟡 Moderate | Request-based |
| ⚡ Cloud Profiler | 🚀 Performance profiling | Code optimisation | 🟡 Moderate | Resource-based |
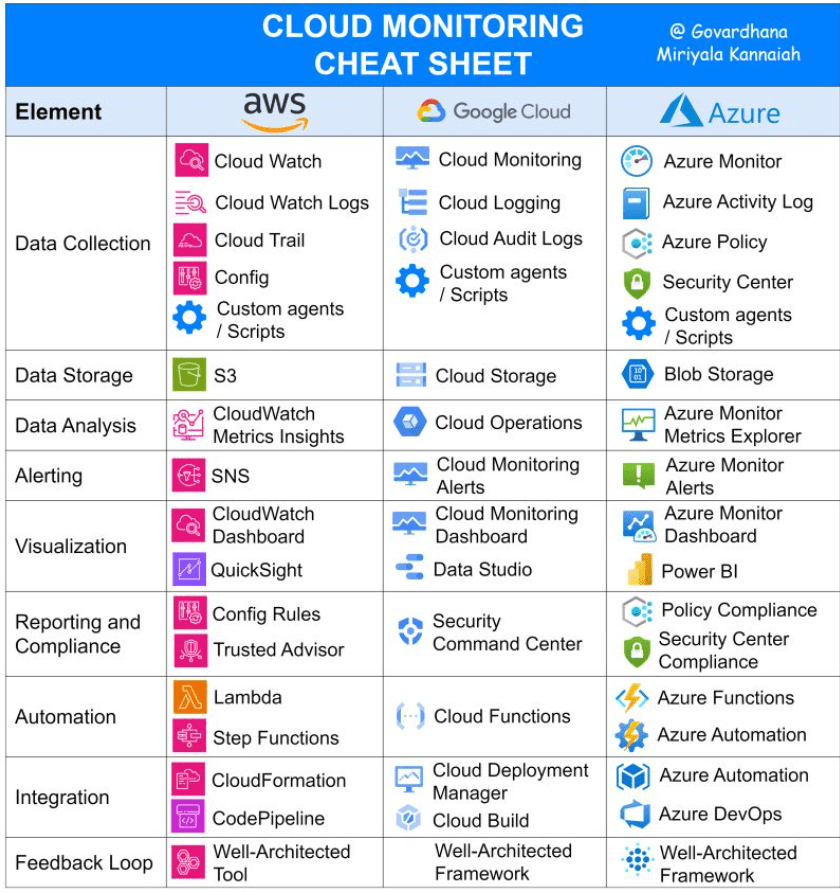
Image Courtesy: Cloud Monitoring on AWS, Google Cloud and Azure? by
Rajesh Kumar
https://www.devopsschool.com/blog/cloud-monitoring-on-aws-google-cloud-and-azure/
🚀 Implementation Strategy for Linux Monitoring Tools
📋 Phased Deployment Roadmap
| Phase | ⏱️ Duration | 🎯 Focus Area | 🛠️ Tools to Deploy | 📊 Success Metrics | 💰 Budget Impact |
| 🟢 Phase 1 | Week 1 | 👁️ Basic visibility | 📊 Netdata, system metrics | System visibility | $ |
| 🟡 Phase 2 | Month 1 | 📈 Metrics collection | 🔥 Prometheus, node exporters | Historical data | $ |
| 🔵 Phase 3 | Month 2 | 📊 Visualisation | 📊 Grafana dashboards | Team adoption | $ |
| 🟣 Phase 4 | Month 3 | 📝 Log management | 🔍 ELK or 📊 Loki stack | Log analysis capability | $$ |
| 🟠 Phase 5 | Month 4 | ⚠️ Advanced alerting | 🔔 AlertManager, PagerDuty | MTTR improvement | $ |
| 🔴 Phase 6 | Month 6 | 🤖 Automation | Integration with admin tools | Automated responses | $ |
🏗️ Tool Integration Architecture
| Integration Layer | 🔧 Components | 🎯 Purpose | 🔌 Data Flow | ⚙️ Automation Level |
| 📊 Data Collection | 🔥 Prometheus, ⚡ Zabbix agents | Metrics gathering | ➡️ Time-series DB | 🤖 Automated |
| 📈 Visualisation | 📊 Grafana, ⚡ Zabbix UI | Dashboard display | ⬅️ From data stores | 👨💼 Manual |
| ⚠️ Alerting | 🔔 AlertManager, 📧 Email | Notification routing | ➡️ To responders | 🤖 Rule-based |
| 🔄 Automation | 🤖 Ansible, 🐍 Python scripts | Response automation | ⬅️ From alerts | 🤖 Fully automated |
| 📝 Documentation | 📊 Confluence, 📝 Wiki | Runbook management | ↔️ Bidirectional | 👨💼 Manual |
🎯 Best Practices for Tool Selection
| Selection Criteria | 🏆 Weight | 🔍 Assessment Questions | 📊 Scoring Method |
| 🏗️ Current Infrastructure | 25% | What systems need monitoring? Scale? | Architecture compatibility |
| 👥 Team Expertise | 20% | What skills exist? Training budget? | Learning curve assessment |
| 💰 Budget Constraints | 20% | Tool costs? Operational overhead? | Total cost of ownership |
| 🔌 Integration Needs | 15% | Existing tools? Future requirements? | API and data compatibility |
| 📈 Scalability Requirements | 10% | Growth projections? Performance needs? | Horizontal scaling capability |
| 🛡️ Security Requirements | 10% | Compliance needs? Data sovereignty? | Security feature assessment |
🚀 Decision Framework:
- 🟢 Start lightweight – Quick wins with tools like Netdata
- 📚 Build expertise – Gradual adoption of complex platforms
- 🔗 Plan integration – Architecture supporting multiple tools
- 📏 Measure effectiveness – Regular assessment and optimisation
This approach aligns with modern infrastructure management principles where monitoring and administration tools work together to provide comprehensive operational visibility.
🔮 Future Trends in Linux Monitoring Tools
📅 Technology Evolution Timeline
| Year | 🚀 Primary Trend | 🔧 Key Technologies | 📊 Impact on Linux Monitoring | 🏆 Leading Tools |
| 2025 | 🤖 AI-Powered Analytics | ML anomaly detection, AIOps | Automated root cause analysis | 🤖 Dynatrace, 📊 Netdata |
| 2026 | 🌍 Edge Observability | IoT monitoring, 5G networks | Distributed monitoring at scale | 📊 Netdata, ☁️ Cloud native |
| 2027 | 🔒 Quantum-Safe Security | Post-quantum cryptography | Secure monitoring communications | 🛡️ Enterprise platforms |
| 2028 | 🎯 Unified Observability | Single-pane-of-glass platforms | Simplified tool consolidation | 📊 Grafana, 🐕 Datadog |
🔄 OpenTelemetry Standardisation Impact
| Benefit Category | 🎯 OpenTelemetry Advantage | 📊 Current Support | 🔮 Future Impact |
| 🔓 Vendor Neutrality | Reduces tool lock-in | 🟡 Growing | 🟢 Universal standard |
| 🔌 Interoperability | Tool compatibility | 🟡 Partial | 🟢 Seamless integration |
| 📱 Instrumentation | Consistent data collection | 🟢 Good | 🟢 Standard approach |
| 🔄 Migration | Simplified tool switching | 🟠 Limited | 🟢 Easy transitions |
OpenTelemetry emerges as the universal standard for observability data collection, benefiting Linux monitoring tools by providing vendor neutrality and consistent instrumentation approaches.
🤖 Artificial Intelligence Integration
| AI Feature | 🎯 Current State | 📊 Tool Examples | 🔮 Future Potential |
| 🔍 Anomaly Detection | 🟢 Widely available | 📊 Netdata, 🤖 Dynatrace | Predictive maintenance |
| 🧠 Root Cause Analysis | 🟡 Basic implementation | 🤖 Dynatrace, 🐕 Datadog | Automated troubleshooting |
| 📈 Capacity Planning | 🟡 Rule-based | 🔥 Prometheus, ⚡ Zabbix | ML-driven predictions |
| ⚠️ Alert Correlation | 🟠 Limited availability | 🐕 Datadog, 📱 New Relic | Intelligent noise reduction |
| 🤖 Auto-remediation | 🟠 Early stage | Custom integrations | Self-healing systems |
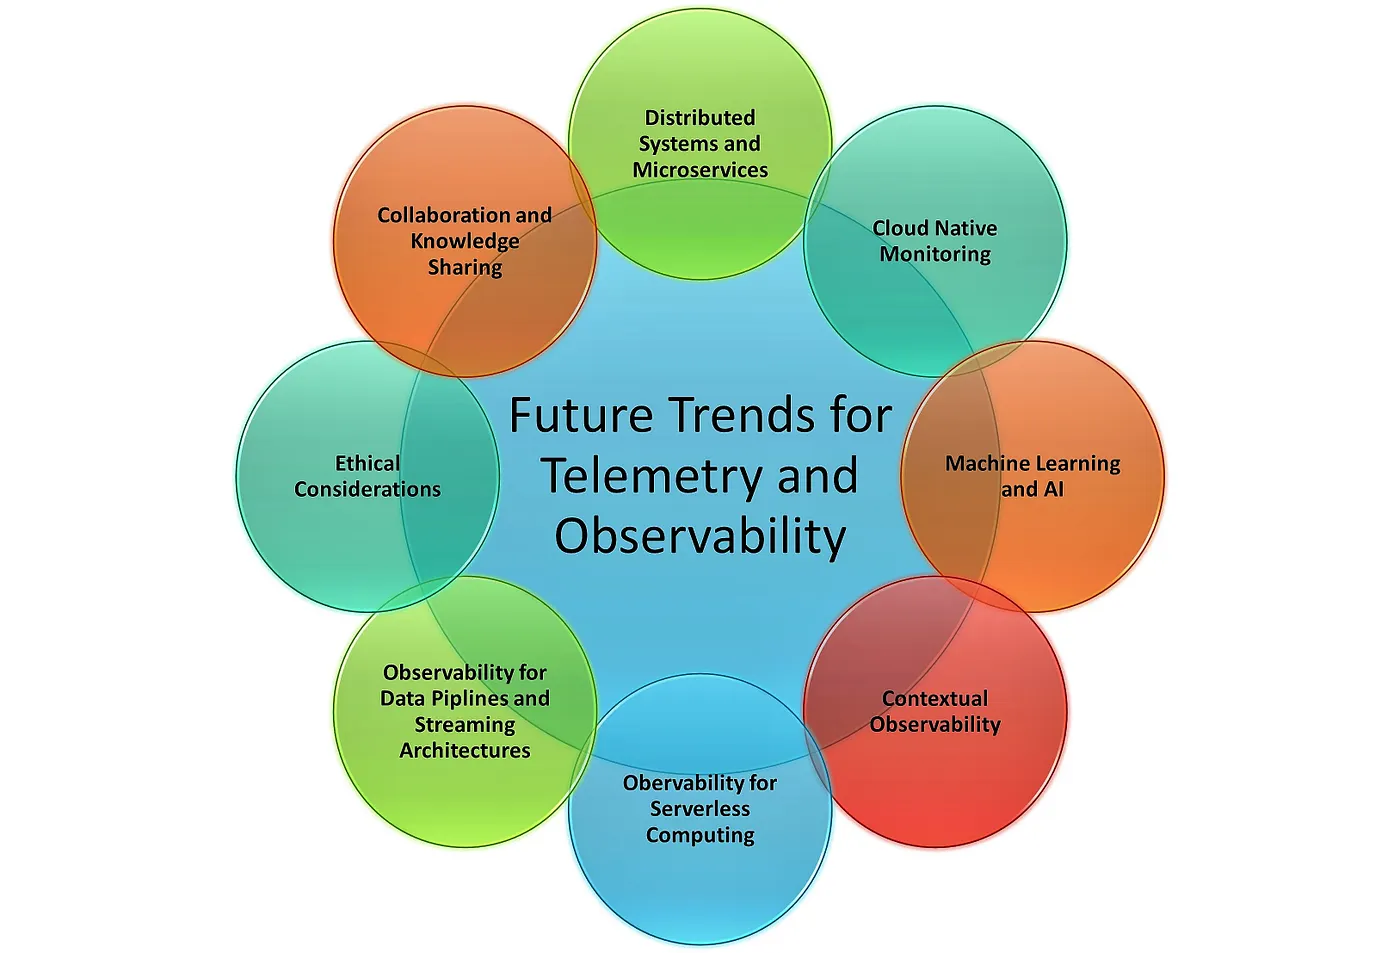
Reference: https://medium.com/@Naveed_Afzal/emerging-trends-in-telemetry-and-observability-shaping-the-future-of-monitoring-complex-systems-24c8893183d4
📋 Environment-Specific Monitoring Tool Recommendations
🏠 Home Lab and Personal Projects
| Need | 🏆 Best Tool | 💰 Cost | 🔧 Setup Time | 📊 Features |
| 🖥️ Single server | 📊 Netdata | 🟢 Free | 5 minutes | Real-time metrics, ML anomalies |
| 📦 Docker containers | 👁️ cAdvisor + 📊 Grafana | 🟢 Free | 30 minutes | Container metrics, dashboards |
| 🏠 Home network | 🌐 LibreNMS | 🟢 Free | 2 hours | Device discovery, SNMP |
| ☁️ Cloud instances | ☁️ Native tools + 📊 Netdata | 🟡 Low cost | 1 hour | Hybrid monitoring |
🚀 Startup and Scale-up Companies
| Growth Stage | 👥 Team Size | 🛠️ Recommended Stack | 💰 Monthly Cost | 🔧 Complexity |
| 🌱 Early (1-5 people) | 1-2 DevOps | 📊 Netdata + 📊 Grafana Cloud | $0-50 | 🟢 Low |
| 📈 Growth (5-20 people) | 2-5 DevOps | 🔥 Prometheus + 📊 Grafana + 📝 Loki | $100-500 | 🟡 Medium |
| 🏢 Scale (20-50 people) | 5-10 DevOps | Multi-tool stack + commercial APM | $1000-5000 | 🔴 High |
| 🚀 Enterprise (50+ people) | 10+ DevOps | Enterprise platforms + consulting | $5000+ | 🔴 Very High |
🏭 Traditional Industries and Legacy Systems
| Industry Type | 🎯 Primary Challenges | 🏆 Recommended Tools | 💡 Special Considerations |
| 🏭 Manufacturing | OT/IT integration, uptime | ⚡ Zabbix + 🌐 LibreNMS | SCADA integration, industrial protocols |
| 🏥 Healthcare | Compliance, availability | 🤖 Dynatrace + ⚡ Zabbix | HIPAA compliance, 24/7 requirements |
| 🏦 Financial Services | Security, compliance | 🐕 Datadog + 🔍 Splunk | PCI DSS, real-time fraud detection |
| 🎓 Education | Budget constraints, variety | ⚡ Zabbix + 📊 Netdata | Mixed infrastructure, limited budget |
| 🏛️ Government | Security, compliance | 🔍 Splunk + ⚡ Zabbix | FedRAMP, data sovereignty |
📊 Detailed Feature Comparison Matrix
🔧 Core Functionality Comparison
| Feature | 🔥 Prometheus | ⚡ Zabbix | 📊 Grafana | 📊 Netdata | 👁️ Nagios | 🔍 Elastic | 🐕 Datadog |
| 📊 Metrics Collection | ⭐⭐⭐⭐⭐ | ⭐⭐⭐⭐⭐ | ❌ | ⭐⭐⭐⭐⭐ | ⭐⭐⭐ | ⭐⭐⭐ | ⭐⭐⭐⭐⭐ |
| 📝 Log Management | ❌ | ⭐⭐⭐ | ❌ | ⭐⭐ | ❌ | ⭐⭐⭐⭐⭐ | ⭐⭐⭐⭐⭐ |
| 📈 Visualisation | ⭐⭐ | ⭐⭐⭐⭐ | ⭐⭐⭐⭐⭐ | ⭐⭐⭐⭐ | ⭐⭐ | ⭐⭐⭐⭐ | ⭐⭐⭐⭐⭐ |
| ⚠️ Alerting | ⭐⭐⭐⭐ | ⭐⭐⭐⭐⭐ | ⭐⭐⭐⭐ | ⭐⭐⭐ | ⭐⭐⭐⭐ | ⭐⭐⭐⭐ | ⭐⭐⭐⭐⭐ |
| 🔍 Tracing | ❌ | ❌ | ⭐⭐⭐ | ❌ | ❌ | ❌ | ⭐⭐⭐⭐⭐ |
| 🤖 AI/ML Features | ❌ | ⭐⭐ | ⭐⭐ | ⭐⭐⭐⭐ | ❌ | ⭐⭐⭐ | ⭐⭐⭐⭐⭐ |
| ☁️ Cloud Integration | ⭐⭐⭐⭐⭐ | ⭐⭐⭐ | ⭐⭐⭐⭐⭐ | ⭐⭐⭐⭐ | ⭐⭐ | ⭐⭐⭐⭐ | ⭐⭐⭐⭐⭐ |
💰 Total Cost of Ownership Analysis
| Tool Category | 🏷️ License Cost | 👨💼 Personnel Cost | 🏗️ Infrastructure Cost | 📚 Training Cost | 💯 Total Score |
| 🟢 Open Source Simple | $0 | 🟢 Low | 🟢 Low | 🟢 Low | 💚 Excellent |
| 🟡 Open Source Complex | $0 | 🔴 High | 🟡 Medium | 🔴 High | 🟡 Good |
| 🔵 Commercial SaaS | 🔴 High | 🟢 Low | $0 | 🟡 Medium | 🟡 Good |
| 🟣 Commercial On-Prem | 🔴 High | 🟡 Medium | 🔴 High | 🟡 Medium | 🔴 Expensive |
🔍 Specialised Linux Monitoring Tools by Category
🛡️ Security-Focused Monitoring Tools
| Tool | 🎯 Security Focus | 🔧 Integration | 📊 Detection Capability | 🌐 Website |
| 🛡️ Falco | 🔒 Runtime security | ☸️ Kubernetes | ⭐⭐⭐⭐⭐ | falco.org |
| 🔍 Wazuh | 🛡️ SIEM + monitoring | 🔍 ELK Stack | ⭐⭐⭐⭐⭐ | wazuh.com |
| 🕷️ OSSEC | 🏠 Host intrusion detection | 📧 Log analysis | ⭐⭐⭐⭐ | ossec.github.io |
| 🔒 Suricata | 🌐 Network security | 🔍 Network analysis | ⭐⭐⭐⭐⭐ | suricata.io |
📊 Application Performance Monitoring (APM)
| APM Solution | 🎯 Speciality | 💻 Language Support | 🔧 Integration Effort | 💰 Pricing Tier |
| 📱 New Relic | 🚀 Application insights | 🟢 15+ languages | 🟢 Low | 💰💰💰 |
| 🐕 Datadog APM | 📊 Full-stack visibility | 🟢 20+ languages | 🟢 Low | 💰💰💰 |
| 🤖 Dynatrace | 🧠 AI-powered analysis | 🟢 Auto-instrumentation | 🟢 Very Low | 💰💰💰💰 |
| 🔍 Jaeger | 🌐 Distributed tracing | 🟡 Manual instrumentation | 🟡 Medium | 🆓 Free |
| 🌊 Zipkin | 🔍 Tracing analysis | 🟡 Library integration | 🟡 Medium | 🆓 Free |
| 🚀 AppDynamics | 📈 Business metrics | 🟢 Auto-discovery | 🟢 Low | 💰💰💰💰 |
🌐 Network-Specific Monitoring Tools
| Network Tool | 🎯 Primary Function | 📊 Device Support | 🔧 Configuration | 💪 Scalability |
| 🌐 LibreNMS | 📡 SNMP monitoring | 🟢 1000+ devices | 🟢 Auto-discovery | ⭐⭐⭐⭐ |
| 🛡️ SolarWinds NPM | 🌐 Network performance | 🟢 Comprehensive | 🟡 Moderate | ⭐⭐⭐⭐⭐ |
| 📊 PRTG | 🏢 Infrastructure monitoring | 🟢 Multi-vendor | 🟢 Sensor-based | ⭐⭐⭐⭐ |
| 🔍 Nagios | 🏛️ Traditional monitoring | 🟡 Plugin-dependent | 🔴 Complex | ⭐⭐⭐ |
| 🌊 Observium | 📡 Network discovery | 🟢 Auto-detection | 🟢 Simple | ⭐⭐⭐ |
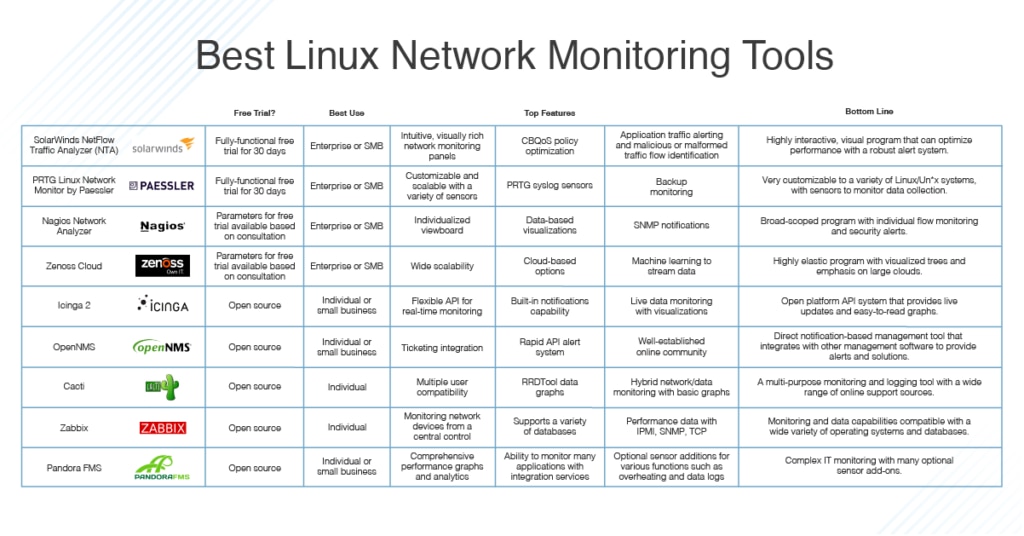
Reference: 19 Best Linux Network Monitoring Tools in 2023 https://www.dnsstuff.com/linux-network-monitoring-tools
⚙️ Implementation Complexity and Resource Requirements
🏗️ Deployment Complexity Matrix
| Tool | 🔧 Initial Setup | ⚙️ Configuration | 📈 Scaling Effort | 👨💼 Maintenance | 🎓 Learning Curve |
| 📊 Netdata | 🟢 5 minutes | 🟢 Zero config | 🟢 Automatic | 🟢 Minimal | 🟢 Very Easy |
| 👀 Glances | 🟢 2 minutes | 🟢 Minimal | 🟡 Manual | 🟢 Low | 🟢 Easy |
| 📊 Grafana | 🟡 30 minutes | 🟡 Dashboard setup | 🟡 Manual | 🟡 Medium | 🟡 Moderate |
| 🔥 Prometheus | 🟡 2 hours | 🔴 Complex YAML | 🔴 Manual scaling | 🔴 High | 🔴 Steep |
| ⚡ Zabbix | 🔴 4 hours | 🟡 Template-based | 🟡 Database scaling | 🟡 Medium | 🟡 Moderate |
| 👁️ Nagios | 🔴 6 hours | 🔴 Text file config | 🔴 Manual effort | 🔴 High | 🔴 Steep |
| 🔍 ELK Stack | 🔴 8 hours | 🔴 Multi-component | 🔴 Cluster management | 🔴 Very High | 🔴 Very Steep |
💻 Resource Requirements Comparison
| Tool | 🖥️ CPU Usage | 💾 RAM Usage | 💿 Storage | 🌐 Network | 🏆 Efficiency Score |
| 📊 Netdata | 🟢 <5% | 🟢 150MB | 🟢 1GB/day | 🟢 Low | ⭐⭐⭐⭐⭐ |
| 👀 Glances | 🟢 <2% | 🟢 50MB | 🟢 Minimal | 🟢 Very Low | ⭐⭐⭐⭐⭐ |
| 🔥 Prometheus | 🟡 5-15% | 🟡 2-8GB | 🔴 High | 🟡 Medium | ⭐⭐⭐ |
| ⚡ Zabbix Server | 🟡 10-20% | 🔴 4-16GB | 🔴 Database heavy | 🟡 Medium | ⭐⭐⭐ |
| 📊 Grafana | 🟢 <5% | 🟡 512MB-2GB | 🟢 Minimal | 🟢 Low | ⭐⭐⭐⭐ |
| 🔍 Elasticsearch | 🔴 20-40% | 🔴 8-32GB | 🔴 Very High | 🔴 High | ⭐⭐ |
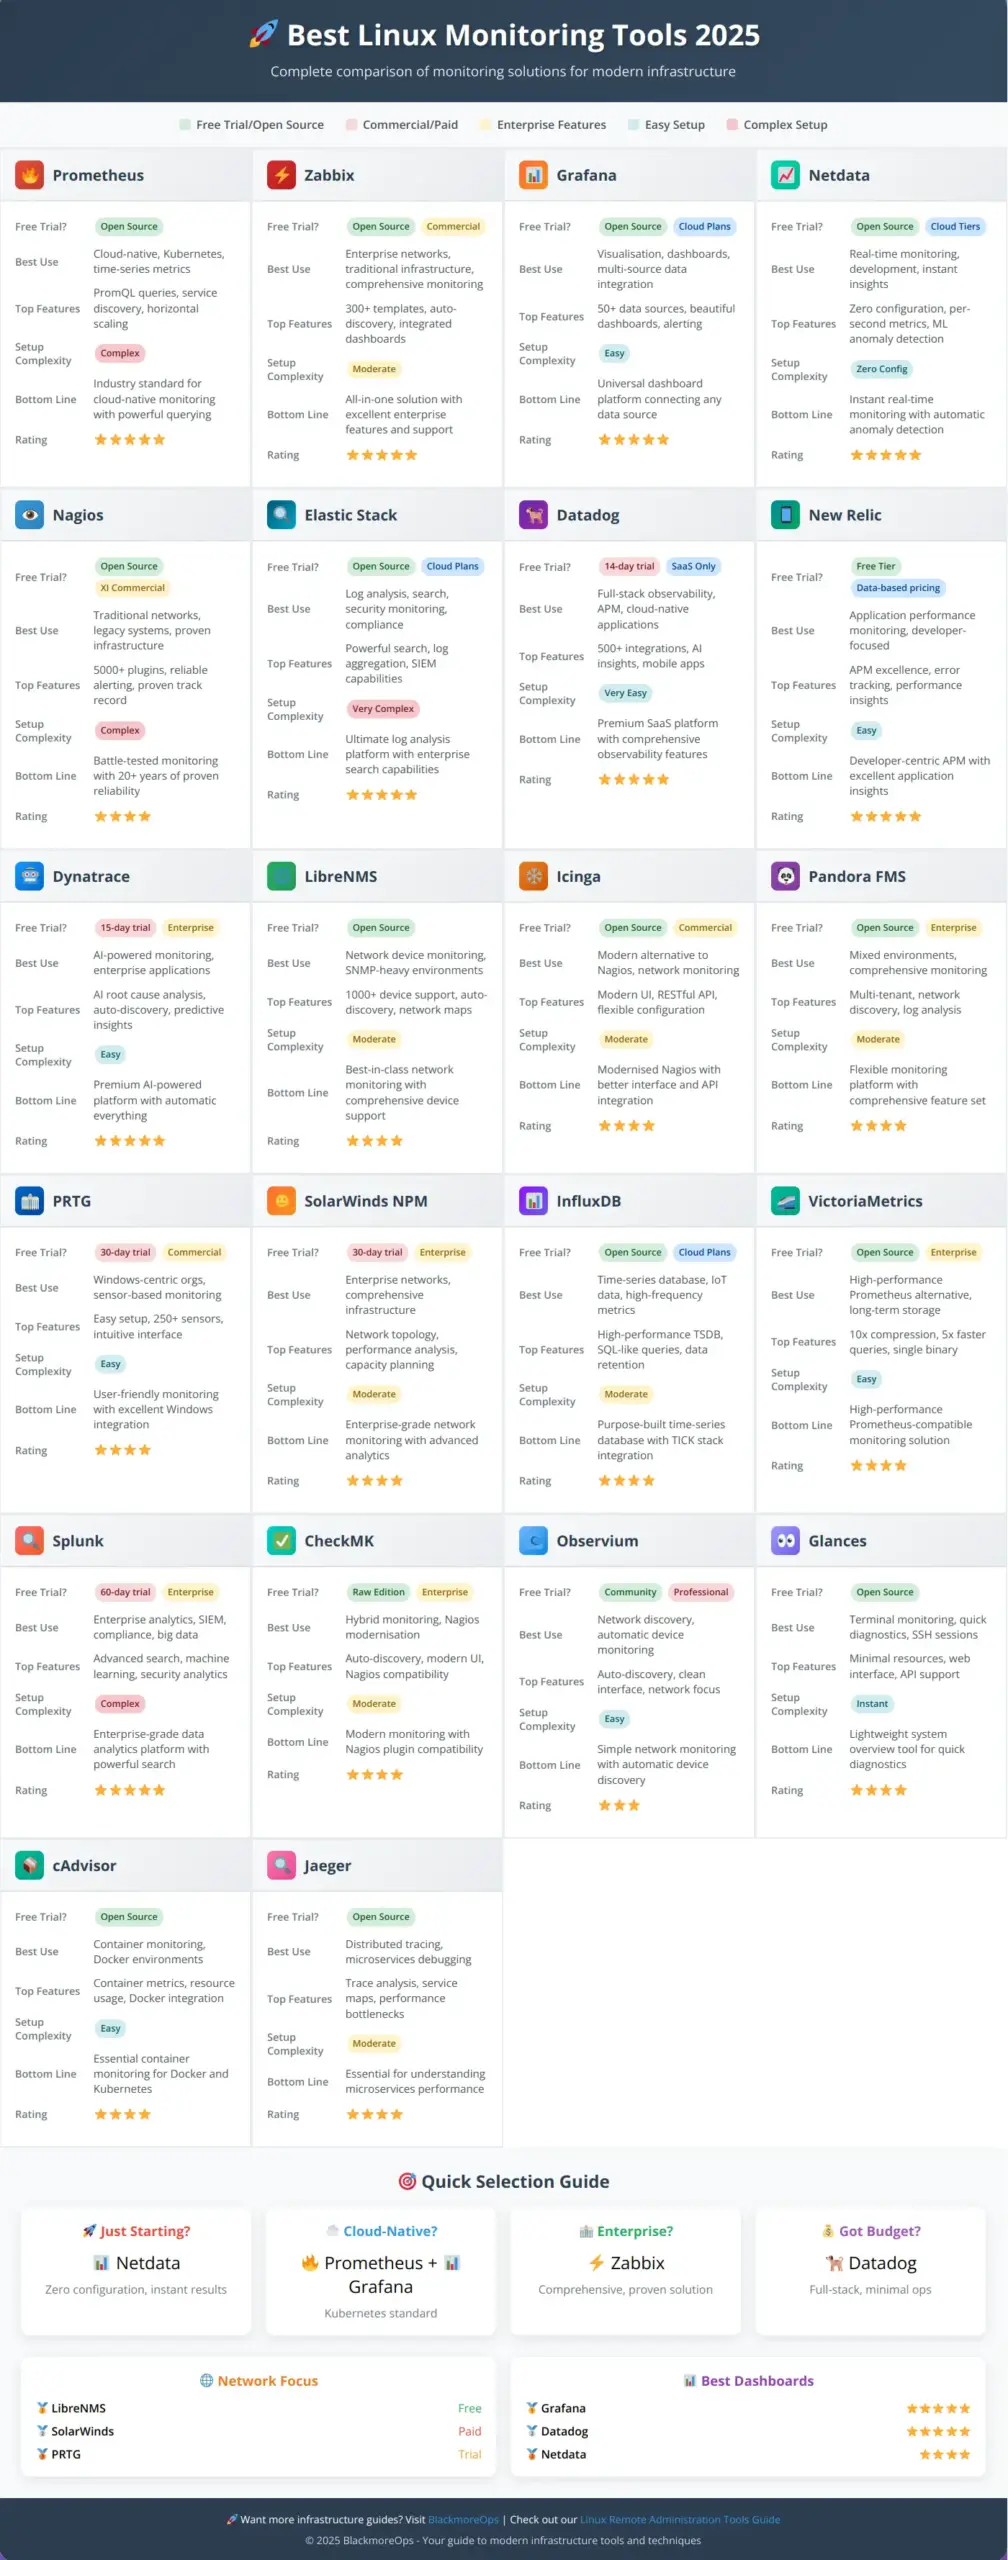
🎯 Quick Selection Guide for Linux Monitoring Tools
🚀 30-Second Tool Selector
| Your Situation | 🏆 Recommended Tool | 🎯 Why This Choice | ⏱️ Setup Time |
| 🆕 Just starting monitoring | 📊 Netdata | Zero config, instant value | 5 minutes |
| 📦 Docker containers | 👁️ cAdvisor + 📊 Grafana | Container-specific + visualisation | 30 minutes |
| ☸️ Kubernetes cluster | 🔥 Prometheus + 📊 Grafana | Industry standard for K8s | 2 hours |
| 🏢 Traditional infrastructure | ⚡ Zabbix | Comprehensive + templates | 4 hours |
| 🌐 Network-heavy environment | 🌐 LibreNMS | Network device specialisation | 2 hours |
| 💰 Budget for commercial | 🐕 Datadog | Full-stack, minimal ops | 1 hour |
| 📝 Log-heavy workloads | 🔍 ELK Stack | Log analysis excellence | 8 hours |
| 🏠 Home lab / learning | 📊 Netdata + 👀 Glances | Lightweight, educational | 10 minutes |
🏗️ Architecture Patterns by Scale
| Scale | 👥 Users | 🖥️ Systems | 🏆 Recommended Architecture | 💰 Est. Monthly Cost |
| 🏠 Personal | 1 | 1-5 | 📊 Netdata + 👀 Glances | $0 |
| 👥 Small Team | 2-10 | 5-50 | ⚡ Zabbix + 📊 Grafana | $0-100 |
| 🏢 Medium Org | 10-100 | 50-500 | 🔥 Prometheus + 📊 Grafana + 📝 Loki | $500-2000 |
| 🏭 Large Enterprise | 100-1000 | 500-5000 | Multi-tool + commercial APM | $5000-20000 |
| 🌐 Global Scale | 1000+ | 5000+ | Enterprise platforms + consulting | $20000+ |
🔄 Migration and Integration Strategies
🚀 Migration Pathways
| Current Tool | 🎯 Migration Target | 🔄 Migration Strategy | ⏱️ Timeline | 🎓 Skill Requirements |
| 👁️ Nagios | 🔥 Prometheus + 📊 Grafana | Gradual service migration | 6-12 months | PromQL, YAML configs |
| ⚡ Zabbix | 🔥 Prometheus ecosystem | Parallel deployment | 3-6 months | Cloud-native concepts |
| 🔍 Legacy ELK | 📊 Grafana stack | Dashboard conversion | 2-4 months | Grafana configuration |
| ☁️ CloudWatch only | Hybrid monitoring | Add open-source tools | 1-3 months | Multi-tool management |
| 📊 Manual monitoring | Modern stack | Complete rebuild | 6-18 months | Full DevOps skills |
🔗 Tool Integration Patterns
| Integration Type | 🔧 Primary Tools | 🔌 Connection Method | 📊 Data Flow | ⚙️ Automation Level |
| 📊 Metrics → Dashboard | 🔥 Prometheus → 📊 Grafana | API/Direct | ➡️ Push/Pull | 🤖 Automatic |
| 📝 Logs → Analytics | 📝 Filebeat → 🔍 Elasticsearch | Shipper agents | ➡️ Stream | 🤖 Automatic |
| ⚠️ Alerts → Response | 🔔 AlertManager → 🤖 Ansible | Webhook triggers | ➡️ Event-driven | 🤖 Automated |
| 📊 Metrics → Storage | 🔥 Prometheus → 📊 Thanos | Remote write | ➡️ Long-term | 🤖 Automatic |
| 🔍 Traces → Analysis | 🔍 Jaeger → 📊 Grafana | Direct integration | ↔️ Bidirectional | 👨💼 Manual |
The integration between monitoring tools and remote administration platforms creates powerful automation workflows that enhance operational efficiency and system reliability.
📱 Mobile and Remote Access Capabilities
📱 Mobile App Support Comparison
| Tool | 📱 Native App | 🌐 Mobile Web | 📊 Feature Completeness | 🔔 Push Notifications | ⭐ User Rating |
| ⚡ Zabbix | ✅ iOS/Android | ✅ Responsive | 🟢 Full features | ✅ Yes | ⭐⭐⭐⭐ |
| 🐕 Datadog | ✅ iOS/Android | ✅ Excellent | 🟢 Complete | ✅ Rich notifications | ⭐⭐⭐⭐⭐ |
| 📱 New Relic | ✅ iOS/Android | ✅ Full-featured | 🟢 Comprehensive | ✅ Smart alerts | ⭐⭐⭐⭐⭐ |
| 📊 Grafana | ❌ No native app | ✅ Mobile-friendly | 🟡 View-only | ❌ Limited | ⭐⭐⭐ |
| 👁️ Nagios | ❌ No official app | 🟡 Basic mobile | 🔴 Limited | ❌ None | ⭐⭐ |
| 📊 Netdata | ❌ No native app | ✅ Excellent mobile | 🟢 Full features | ❌ Browser-based | ⭐⭐⭐⭐ |
🔔 Notification and Alerting Capabilities
| Alert Channel | 🔥 Prometheus | ⚡ Zabbix | 👁️ Nagios | 📊 Netdata | 🐕 Datadog |
| 📧 Email | ✅ Via AlertManager | ✅ Built-in | ✅ Native | ✅ Basic | ✅ Advanced |
| 📱 SMS | ✅ Via webhooks | ✅ Built-in | ✅ Scripts | ❌ No | ✅ Native |
| 💬 Slack | ✅ Native integration | ✅ Webhooks | 🟡 Plugins | ❌ Limited | ✅ Rich integration |
| 📞 PagerDuty | ✅ Direct integration | ✅ API integration | 🟡 Custom | ❌ No | ✅ Native |
| 📱 Microsoft Teams | ✅ Webhooks | ✅ API | 🟡 Custom | ❌ No | ✅ Integration |
| 🔔 Push Notifications | ❌ No | ✅ Mobile apps | ❌ No | ❌ No | ✅ Mobile apps |
🏆 Recommendation Engine: Choose Your Perfect Stack
🎯 By Organisation Profile
| Organisation Type | 👥 Team Size | 💰 Budget | 🏆 Recommended Stack | 📊 Confidence Level |
| 🚀 Tech Startup | 5-20 | $ – $ | 🔥 Prometheus + 📊 Grafana + 📊 Netdata | ⭐⭐⭐⭐⭐ |
| 🏢 Traditional SMB | 2-10 | $ | ⚡ Zabbix + 📊 Netdata | ⭐⭐⭐⭐⭐ |
| 🏭 Manufacturing | 10-50 | $ | ⚡ Zabbix + 🌐 LibreNMS + 🔍 Wazuh | ⭐⭐⭐⭐ |
| 🏦 Financial Services | 50-200 | $$ | 🐕 Datadog + 🔍 Splunk + compliance tools | ⭐⭐⭐⭐⭐ |
| 🎓 Education | 5-30 | $ | ⚡ Zabbix + 📊 Grafana + 📊 Netdata | ⭐⭐⭐⭐ |
| 🏥 Healthcare | 20-100 | $ – $$ | 🤖 Dynatrace + ⚡ Zabbix + compliance | ⭐⭐⭐⭐ |
| 🏛️ Government | 50-500 | $ | 🔍 Splunk + ⚡ Zabbix + security tools | ⭐⭐⭐⭐ |
🎯 By Technical Requirements
| Requirement | 🏆 Best Tool Choice | 🔄 Alternative | 💡 Why This Tool | 📊 Fit Score |
| ⚡ Real-time monitoring | 📊 Netdata | 👀 Glances | Per-second updates, zero config | ⭐⭐⭐⭐⭐ |
| ☁️ Cloud-native apps | 🔥 Prometheus + 📊 Grafana | 🐕 Datadog | Kubernetes integration, scalability | ⭐⭐⭐⭐⭐ |
| 🌐 Network infrastructure | 🌐 LibreNMS | 🛡️ SolarWinds NPM | SNMP expertise, device support | ⭐⭐⭐⭐⭐ |
| 📝 Log analysis | 🔍 ELK Stack | 📊 Grafana Loki | Search capabilities, indexing | ⭐⭐⭐⭐⭐ |
| 🏢 Enterprise compliance | ⚡ Zabbix + 🔍 Splunk | 🤖 Dynatrace | Reporting, audit trails | ⭐⭐⭐⭐ |
| 🏠 Home lab learning | 📊 Netdata + 👀 Glances | 📊 Grafana + 🔥 Prometheus | Learning curve, resource usage | ⭐⭐⭐⭐⭐ |
| 📦 Container monitoring | 🔥 Prometheus + 👁️ cAdvisor | 🐕 Datadog | Container metrics, orchestration | ⭐⭐⭐⭐⭐ |
🔧 Advanced Linux Monitoring Tools Features
🤖 AI and Machine Learning Capabilities
| AI Feature | 📊 Netdata | 🤖 Dynatrace | 🐕 Datadog | 📱 New Relic | 🔍 Splunk | ⚡ Zabbix |
| 🔍 Anomaly Detection | ✅ Real-time ML | ✅ Advanced AI | ✅ ML algorithms | ✅ Applied ML | ✅ MLTK | 🟡 Basic rules |
| 🎯 Root Cause Analysis | 🟡 Basic correlation | ✅ AI-powered | ✅ Correlation engine | ✅ ML insights | ✅ Investigation | ❌ Manual |
| 📈 Predictive Analytics | 🟡 Trend analysis | ✅ Forecasting | ✅ Predictive alerts | ✅ Proactive detection | ✅ Predictive analytics | 🟡 Trending |
| ⚠️ Alert Intelligence | 🟡 Basic filtering | ✅ Smart alerting | ✅ Alert correlation | ✅ Incident intelligence | ✅ Adaptive response | 🟡 Escalation rules |
| 🔄 Auto-remediation | ❌ None | ✅ Auto-actions | ✅ Workflow automation | 🟡 Basic automation | ✅ Phantom integration | 🟡 Scripts |
🔒 Security and Compliance Features
| Security Aspect | 🔥 Prometheus | ⚡ Zabbix | 🔍 ELK Stack | 🐕 Datadog | 👁️ Nagios | 📊 Netdata |
| 🔐 Authentication | 🟡 Basic auth | ✅ LDAP/SAML | ✅ Enterprise auth | ✅ SSO/RBAC | 🟡 Basic auth | 🟡 Basic auth |
| 🛡️ Data Encryption | 🟡 TLS support | ✅ Full encryption | ✅ Encryption at rest | ✅ End-to-end | 🟡 TLS support | 🟡 TLS support |
| 📋 Compliance | 🟡 Basic logging | ✅ Audit trails | ✅ Compliance tools | ✅ SOC2/HIPAA | 🟡 Basic logging | 🟡 Basic logging |
| 🔒 Access Control | 🟡 File-based | ✅ RBAC system | ✅ Fine-grained | ✅ Advanced RBAC | 🟡 File-based | 🟡 Basic controls |
| 📊 Data Sovereignty | ✅ Self-hosted | ✅ Self-hosted | ✅ Self-hosted | 🟡 SaaS/regions | ✅ Self-hosted | ✅ Self-hosted |
📊 Performance Benchmarks and Scalability
⚡ Performance Metrics Comparison
| Metric | 📊 Netdata | 🔥 Prometheus | ⚡ Zabbix | 🔍 InfluxDB | 👁️ Nagios | 🌊 VictoriaMetrics |
| 📊 Metrics/Second | 1M+ | 100K+ | 50K+ | 500K+ | 5K+ | 1M+ |
| ⏱️ Query Response | <100ms | 200-500ms | 500ms-2s | 100-300ms | 1-5s | <50ms |
| 💾 Storage Efficiency | High | Standard | Database-dependent | High | File-based | Very High |
| 🔄 Retention Period | Hours-Days | Weeks | Configurable | Configurable | Limited | Years |
| 📈 Horizontal Scaling | Edge distribution | Federation | Proxy servers | Clustering | Manual effort | Clustering |
🏗️ Infrastructure Requirements by Scale
| Scale Tier | 🖥️ Servers Monitored | 💾 RAM Required | 🖥️ CPU Cores | 💿 Storage/Month | 🏆 Recommended Tool |
| 🏠 Micro (1-10) | 1-10 | 1-2GB | 1-2 cores | 10-50GB | 📊 Netdata |
| 👥 Small (10-100) | 10-100 | 4-8GB | 2-4 cores | 100-500GB | ⚡ Zabbix |
| 🏢 Medium (100-1K) | 100-1000 | 16-32GB | 4-8 cores | 1-5TB | 🔥 Prometheus stack |
| 🏭 Large (1K-10K) | 1000-10000 | 64-128GB | 8-16 cores | 10-50TB | Multi-tool enterprise |
| 🌐 Massive (10K+) | 10000+ | 256GB+ | 16+ cores | 100TB+ | Commercial platforms |
🎓 Learning Resources and Community Support
📚 Documentation and Training Quality
🏆 Community Activity and Ecosystem Health
| Metric | 🔥 Prometheus | 📊 Grafana | ⚡ Zabbix | 👁️ Nagios | 📊 Netdata | 🔍 Elastic |
| ⭐ GitHub Stars | 55K+ | 63K+ | 4K+ | 1.5K+ | 71K+ | 69K+ |
| 🔧 Contributors | 1,800+ | 1,200+ | 400+ | 200+ | 400+ | 1,700+ |
| 📦 Plugin Ecosystem | 800+ exporters | 400+ plugins | 300+ templates | 5000+ plugins | 200+ collectors | 300+ beats |
| 💬 Forum Activity | 🟢 Very Active | 🟢 Very Active | 🟢 Active | 🟡 Moderate | 🟡 Growing | 🟢 Very Active |
| 📅 Release Frequency | 🟢 Regular | 🟢 Frequent | 🟡 Stable | 🟠 Slow | 🟢 Frequent | 🟢 Regular |
🛠️ Practical Implementation Examples
🚀 Quick Start Commands
| Tool | 🚀 One-Line Install | ⚙️ Basic Config | 🌐 Access URL | ⏱️ Time to Value |
| 📊 Netdata | bash <(curl -Ss https://my-netdata.io/kickstart.sh) | Zero config needed | http://localhost:19999 | 2 minutes |
| 👀 Glances | pip install glances | glances -w | http://localhost:61208 | 1 minute |
| 📊 Grafana | docker run -d -p 3000:3000 grafana/grafana | Login admin/admin | http://localhost:3000 | 5 minutes |
| 🔥 Prometheus | docker run -p 9090:9090 prom/prometheus | Need config file | http://localhost:9090 | 15 minutes |
| ⚡ Zabbix | docker-compose up | Web wizard setup | http://localhost:80 | 30 minutes |
🔧 Configuration Examples
| Monitoring Scenario | 🛠️ Tool Combination | 📋 Config Complexity | 🎯 Outcome |
| 🏠 Home Lab | 📊 Netdata + 👀 Glances | 🟢 Minimal | Real-time system insights |
| 📦 Docker Environment | 👁️ cAdvisor + 📊 Grafana | 🟡 Moderate | Container performance dashboards |
| ☸️ Kubernetes Cluster | 🔥 Prometheus Operator | 🟡 Moderate | Production-ready K8s monitoring |
| 🌐 Network Operations | 🌐 LibreNMS + ⚡ Zabbix | 🔴 Complex | Comprehensive network visibility |
| 🏢 Hybrid Infrastructure | Multi-tool integration | 🔴 Very Complex | Complete observability stack |
📊 Final Recommendations Matrix
🎯 The Ultimate Selection Guide
| Your Priority | 🏆 Top Choice | 🥈 Runner-up | 🥉 Budget Option | 💡 Reasoning |
| ⚡ Fastest Setup | 📊 Netdata | 👀 Glances | 📊 Grafana Cloud | Zero configuration wins |
| 💰 Cost Effectiveness | ⚡ Zabbix | 📊 Netdata | 👁️ Nagios | Free + comprehensive |
| ☁️ Cloud-Native | 🔥 Prometheus + 📊 Grafana | 🐕 Datadog | ☁️ Cloud provider native | Kubernetes standard |
| 🏢 Enterprise Features | 🤖 Dynatrace | 🐕 Datadog | ⚡ Zabbix Commercial | Professional support |
| 📈 Scalability | 🔥 Prometheus Federation | 🌊 VictoriaMetrics | ⚡ Zabbix Proxy | Horizontal scaling |
| 👨💼 Ease of Management | 🐕 Datadog | 📱 New Relic | ⚡ Zabbix | Operational simplicity |
| 🔍 Deep Analysis | 🔍 Elastic Stack | 🔍 Splunk | 📊 Grafana Loki | Advanced analytics |
🎯 Conclusion and Strategic Guidance
The landscape of Linux monitoring tools in 2025 offers unprecedented choice and capability. Success depends on matching tools to specific requirements rather than adopting the most popular solutions. Consider your infrastructure architecture, team capabilities, budget constraints, and long-term objectives when selecting monitoring tools.
🌟 Universal Recommendations
| Principle | 🎯 Strategy | 🛠️ Implementation | 📊 Expected Outcome |
| 🟢 Start Simple | 📊 Netdata for immediate value | 5-minute installation | Instant system visibility |
| 📚 Build Expertise | Gradual adoption of sophisticated platforms | Monthly skill building | Team proficiency growth |
| 🔗 Plan Integration | Multi-tool strategy vs monoliths | Architecture planning | Comprehensive coverage |
| 📏 Standardise | OpenTelemetry and common formats | Standard instrumentation | Future-proof flexibility |
| 🤖 Automate | Integration with admin tools | Response automation | Operational efficiency |
🎯 Environment-Specific Final Guidance
| Environment | 🏆 Optimal Stack | 💰 Budget Range | 🎓 Skill Level | 📈 Growth Path |
| 🏠 Personal/Home | 📊 Netdata + 👀 Glances | $0 | 🟢 Beginner | Add 📊 Grafana |
| 👥 Small Teams | ⚡ Zabbix + 📊 Grafana | $0-200/month | 🟡 Intermediate | Add log management |
| 🏢 Growing Orgs | 🔥 Prometheus ecosystem | $500-2000/month | 🔴 Advanced | Add commercial APM |
| 🏭 Enterprises | Multi-tool + commercial | $5000+/month | 🔴 Expert | Full observability platform |
The evolution toward comprehensive observability continues reshaping Linux monitoring tools. The most successful implementations combine multiple specialised tools rather than relying on monolithic solutions. This approach, supported by proper infrastructure administration practices, creates robust, scalable monitoring architectures capable of supporting modern application demands.
Click download button to download 🚀 Best Linux Monitoring Tools 2025 PDF
Choose Linux monitoring tools that align with your current needs while providing growth paths for future requirements. The investment in proper monitoring infrastructure pays dividends through improved reliability, faster troubleshooting, and enhanced operational efficiency across your entire technology stack.
🚀 Next Steps:
- 📋 Assess your current monitoring gaps
- 🎯 Select tools based on the matrices above
- 🚀 Start with lightweight tools for quick wins
- 📈 Scale gradually as expertise builds
- 🔄 Iterate based on operational feedback