2023-12-20 07:11:45 Author: blogs.sap.com(查看原文) 阅读量:12 收藏
Observability, in the context of application monitoring, refers to the ability to gain insights into the internal workings of a system by collecting, analyzing, and visualizing relevant data. This practice enables developers, operations teams, and other stakeholders to understand the performance, behavior, and health of an application. Observability is a crucial topic for ensuring a seamless and reliable user experience.
Here are the key components of observability for monitoring SAP Commerce Cloud solutions and the tools provided.
Monitoring Metrics
Metrics are quantitative measurements that provide information about various aspects of an application’s performance.
Examples: Response times, error rates, throughput, resource utilization (CPU, memory), database query performance, and network latency.
Importance: Metrics help identify performance bottlenecks, track system health, and understand the impact of changes on the application.
In terms of monitoring metrics the best place to start is the Dynatrace Dashboards. The Dynatrace dashboards provide you with a visual, high-level status on a number of aspects of your system such as performance, system health, and errors. While Dynatrace includes a series of dashboard tiles by default, SAP also provides a collection of dashboard tiles that are tailored specifically to be compatible with SAP features.

For more information check Using Dashboards.
Tracing
Tracing involves tracking the flow of a request or transaction as it moves through various components of a distributed system.
Examples: Distributed tracing allows you to follow the path of a user request from the frontend to backend services and databases.
Importance: Tracing helps identify latency issues, understand dependencies between services, and troubleshoot performance bottlenecks.
The Dynatrace, Distributed-traces analysis provides a waterfall visualization of all requests. Each service in the call chain is represented in the analysis.
The Execution breakdown section at the top of the page shows how the time spent by the transaction is distributed. The waterfall chart shows much more detail. You can see:
- Which other services are called and in which order.
- Other services called and the order in which they’re called.
- Subsequent calls to services called by the ones under analysis.
See an example of a distributed trace analysis provided for a single request below;

The distributed-trace analysis provides an end-to-end web-request visualizations, in this case, that of a single request. The colors and positions of the horizontal bars in the chart indicate both the sequence and response time of each of the requests. You can easily see which calls were executed synchronously and which were executed in parallel.
You can also reach the distributed traces feature through services tab which looks like below;

Alerting
Alerting involves setting up notifications for specific events or conditions that require attention.
Examples: Alerts for high error rates, prolonged response times, or system resource exhaustion.
Importance: Alerts enable proactive responses to potential issues, helping teams address problems before they impact users.
Dynatrace alerting mechanism is quite sophisticated. It has the capability to learn the typical reference values of your application and service response times, error rates, traffic. And making use of the built-in anomaly detection framework, it is able to detect statistically significant deviations from forecasted traffic levels thus raising an alert.
Below you can see a Problem Analysis view for an alert triggered based on the metric anomalies by Davis AI from Dynatrace.

Problem Analysis
In order to receive monitoring alerts there are alternative ways provided, see Receiving Monitoring Alerts for the necessary configuration.
Distributed Systems Visibility
For any SAP Commerce Cloud implementation, understanding the interactions between services is crucial. Distributed System Visibility features makes it possible to understand the interaction between services easily.
Examples: Service maps, dependency graphs, and insights into communication patterns between services.
Importance: Visibility into the interactions of distributed components helps in identifying bottlenecks, understanding the impact of service failures, and optimizing communication.
In order to illustrate the sequence of service calls that are triggered by each service request in your environment Dynatrace provides Service Flow view. With service flow, you see the flow of service calls from the perspective of a single service, request or their filtered subset. Along with the specific services that are triggered, you can also see how each component of a request contributes to the overall response time.

Service Flow Diagram
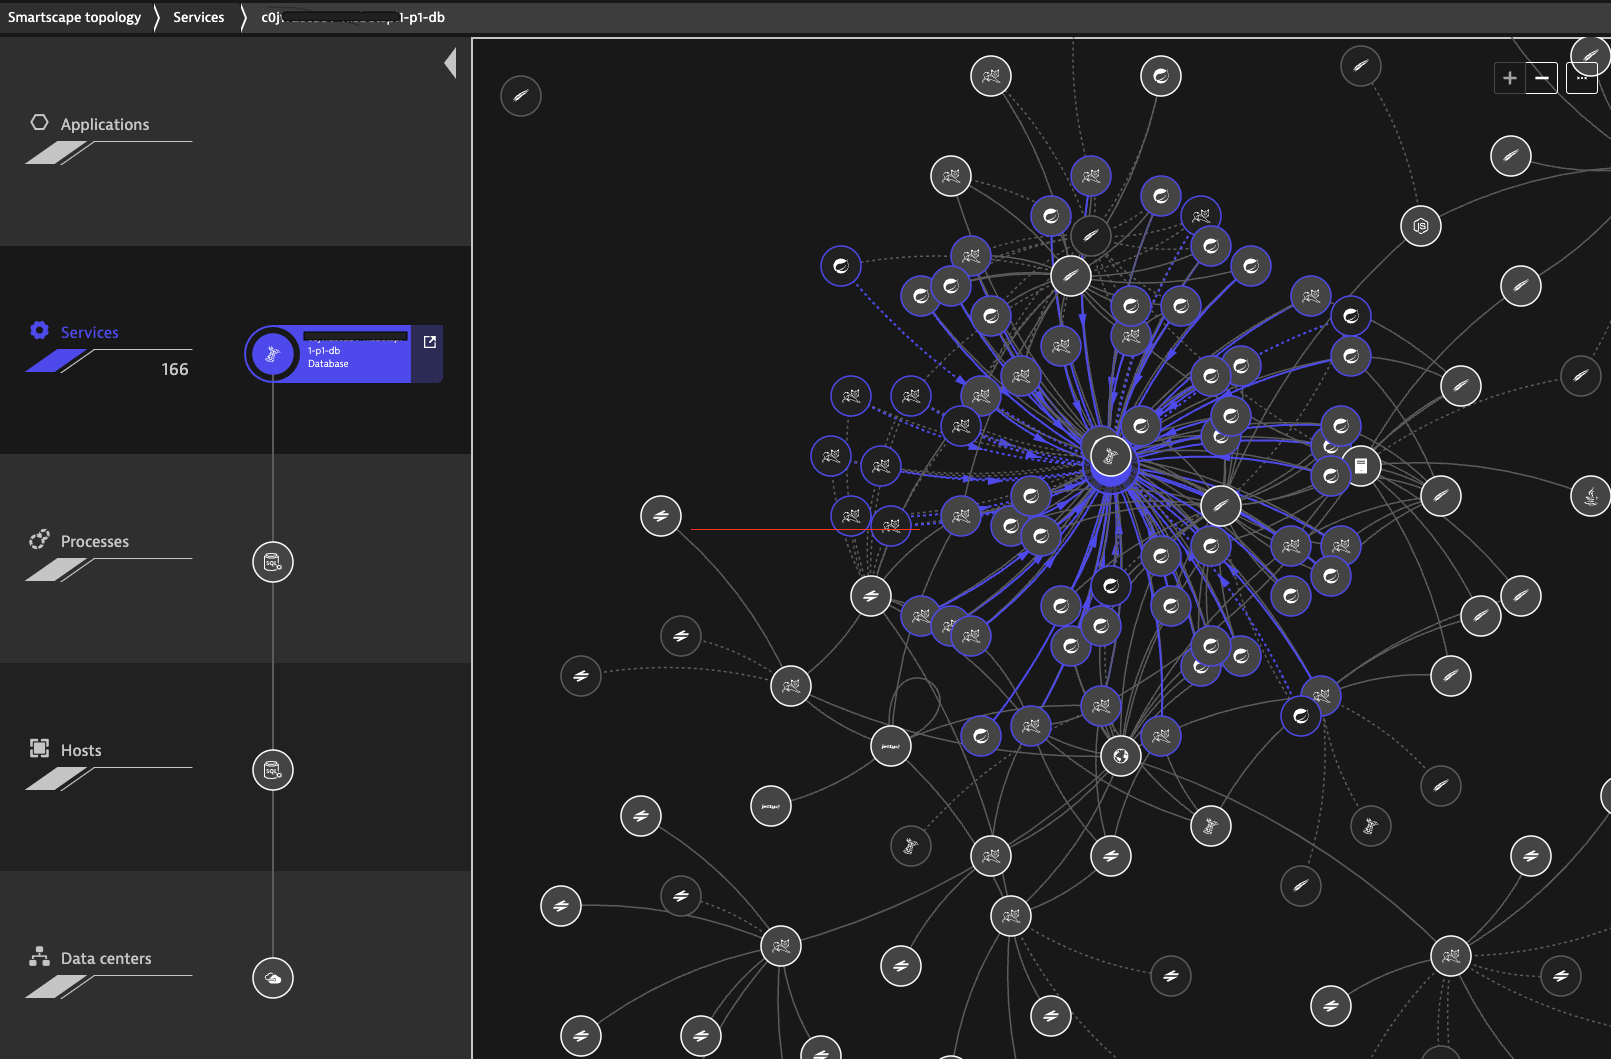
Additionally, Smartscape topology view offers a fast and convenient visualization of all the dependencies between your applications, services, processes, host and data centers.

On the vertical axis, Smartscape Topology displays full-stack dependencies across all tiers. On the horizontal axis, it visualizes all ingoing and outgoing call relationships within each tier.
User Experience Monitoring
Dynatrace has the capability of monitoring and measuring the end-user experience to ensure optimal performance and usability.
Examples: Real User Monitoring (RUM) to track page load times, user interactions, and identify performance issues experienced by actual users.
Importance: User experience monitoring provides insights into how users interact with the application and helps prioritize improvements that directly impact users.
In terms of User Experience Monitoring for SAP Commerce Cloud customers, Dynatrace provides additional Dashboards configured as Paid Add-ons.
- Digital Experience – Real User Monitoring/RUM: Using Dynatrace’s Real User Monitoring (RUM) and Key Performance Indicators (KPI), this dashboard provides an overview of the real-time user activities, user behaviors, and user experiences on the customer’s site
- Digital Experience – Synthetic Monitoring: Displays the results of simulated user experiences including site availability, responsiveness, errors and site breakdowns
- Digital Experience 360: Displays segmented and aggregated user session data describing the user experience.
Read more on Digital Experience Monitoring here.
Continuous Profiling
Profiling involves collecting detailed performance data about the execution of code.
Examples: CPU profiling, memory profiling, and identifying hotspots in the code.
Importance: Continuous profiling helps identify performance bottlenecks at the code level, enabling developers to optimize critical paths.
In terms of profiling of SAP Commerce Cloud solutions, Dynatrace offers a collection of diagnostic tools that can be used to manually detect issues via different views:
- Continuous CPU profiling helps you to understand the CPU usage of the processes down to the code level.
- Memory dumps allows you to trigger and analyze memory dumps on Java, .NET and Node.js.
- Process crashes tracks all application crashes and enables analysis.
- Top web requests analyzes the most frequent and most expensive web requests. This includes multi-dimensional analysis and distributed traces.
- Exception analysis is available for all code-level exceptions.
- Top database statements analyzes the most frequent and most expensive database statements.

Profiling and Optimization View
For more information, view Continuous CPU/Memory profiling, Memory Dumps and Process Crashes
Audit Trails and Compliance
Maintaining audit trails for compliance, security, and accountability purposes is also part of observability.
Examples: Record-keeping for user actions, transactions, and changes to sensitive data.
Importance: Audit trails support compliance with regulatory requirements and help in investigating security incidents or unauthorized activities.
In terms of auditing following features are available in SAP Commerce Cloud.
Audit logging makes it possible to log selected events such as such as user logins, password changes, property value modifications, database operations, closed sessions, ImpEx web imports, Flexible or SQL queries, or started, completed, and aborted cron jobs, in a durable and tamper-proof way. See Audit Logging
In addition to above SAP Commerce Cloud has a built-in Generic Audit feature that can be used to audit tracks of every persistence action, including creation, modification, and deletion for specified types. The audit records are stored as a change log that allows you to see how an item changed over time. See Generic Audit to learn more about this feature.
Logging
Logging involves recording events, errors, and specific information during the execution of an application.
Examples: Error logs, access logs, and custom logs for specific application events or transactions.
Importance: Logs are valuable for diagnosing issues, tracing the flow of transactions, and understanding the sequence of events leading up to errors.
SAP Commerce Cloud provides logging capabilities to assist in monitoring, troubleshooting, and understanding the behavior of the Commerce platform. You can easily access to the centralized logging feature from the SAP Commerce Cloud portal. See Accessing Environment Logs
The Logs include custom logging and logs for all infrastructure applications that serve these applications. Each environment or tenant has its own logging infrastructure. OpenSearch is the underlying logging management plug-in and you can access it from the Cloud Portal.
It is possible to see/monitor the logs for each environment including deployment logs and filter them based on specific services/pods.

Cloud Logging – Discover
For logging features available in SAP Commerce Cloud see Logging.
To get more details on the available logs as part of your SAP Commerce Cloud solution see Cloud Portal Logs.
Data Retention Period
The SAP service data retention policy allows customer organisations to preserve critical information about their system performance, ensuring accurate readings and analysis.
Standard Dynatrace data retention policy (calendar days)
- Code-level data: 10 days
- Service-level data: 14 days
The transactional data storage capacity depends on the type of environment
- Stage/Development environments: 10 GB
- Production environments: 100 GB
If the upper storage limit is exceeded before the time period expires, the system truncates older data. So you won’t be able to go back and see older data when it’s been truncated. However, if needed, extra storage capacity can be purchased.
Following screenshot shows the availability of Code-level and Service-level data monitored over a period of time with storage limits applied.

Distributed Traces over Time
For the Logs current log retention according to the standard plan is as follows:
| Environment | OpenSearch Net Capacity | Throughput |
|---|---|---|
| Development | 75GB | 2500 logs/second |
| Staging | 100GB | 2500 logs/second |
| Production | 100GB | 2500 logs/second |
If you expect that your logs may exceed the standard plan, you can purchase a larger plan for your PROD environment that includes the following benefits:
- OpenSearch net capacity: 1TB – 5TB
- Throughput: 15000 logs/second
- Throughput peak: 25000 logs/second
For more information about log storage, see Commerce Logs Blob Storage.
如有侵权请联系:admin#unsafe.sh