2023-12-1 06:21:38 Author: blogs.sap.com(查看原文) 阅读量:6 收藏
The ‘Customer Insights‘ dashboard is an interactive reporting developed in SAP for Me to power the success of your SAP investment with proactive and timely status updates of your SAP solutions across all products, support contracts and deployment types. The realization happens using the phased approach when the content will be delivered with several releases.
Recently the section ‘Cloud Availability’ has been released in the ‘Customer Insights‘ dashboard, which will be introduced below in detail.
Cloud Availability section – description.
You can access this section from the Entry page using the relevant ‘Summary’ card below or by using the section “Cloud Availability” in the Tab Menu.

Summary Card for Cloud Availability Section
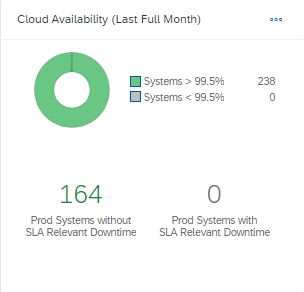
This section provides you with an overview on the availability situation across all cloud systems in your solution portfolio at one glance.

Cloud Availability data section
The cloud systems are grouped by the Solution Areas and displayed for the last 12 months.
In case the availability of at least one system in the solution area is below the threshold the color of this month segment is orange. If the availability of at least one system is below 100% but still within the threshold, the month segment is grey. Green indicates 100% availability. Using this color code you can immediately see the solution areas with critical downtimes and expand them to see the details.
In the expand mode you can see which systems are affected, and what is the availability percentage for each month. Using the special filters in the right upper corner of this section you can change the display from % to hours to see the total time of outages.
If your systems are covered by a different or an additional support contracts with higher availability threshold than the standard of 99,5%, you can change the threshold and the picture will be updated accordingly.
Additional filters provided for this section allow you to focus only on productive systems or only on a particular data center.

Availability Overview with changed filters
Using the system number as link you can navigate to the SAP for Me / Systems & Provisioning / Availability to exact this system and check its SLA related outages, their root cause or check for the planned maintenance.

Example for navigation into SAP for Me / Systems and Provisioning
The new availability view in Customer Insights saves you from endless scrolling through the lists of systems to find some which have critical availability. Using the filters on top of the section you still can select systems relevant for a particular Solution Area, or Software Product or simply select some systems from the drop down menu.
Please use the ‘Feedback’ slider on the right edge of the page of the application to share with us your feedback on this new tool and help us to improve the reporting functionality in SAP for Me.
Stay updated by subscribing to this blog and visiting the SAP Support Portal / Customer Insights.
SAP for Me is made for you!
Related blogs: SAP for Me Goes Reporting
如有侵权请联系:admin#unsafe.sh