2023-11-24 22:31:2 Author: blogs.sap.com(查看原文) 阅读量:8 收藏
The SAP solution Environment, Health, and Safety (EHS) has always strived for analytical insights into the big amount of environmental and safety data collected over time, be it a connection to the SAP Business Warehouse or be it analytical capabilities in specific info-system-like EHS applications.
The latest approach to this topic is called EHS – Sustainable Operations Insights and consists of a new so-called story – a kind of visualization scenario – in SAP Analytics Cloud.
This article gives an overview of the functional capabilities, and it furthermore points to additional documentation on the topic.
The relevant SAP Analytics Cloud content is available with content release Q4.2023.
Data visualization in SAP Analytics Cloud is done using stories. Stories define the chart types (bar chart, pie chart, geo map, …) that are used together with their data sources and filter settings; they also define how these charts are arranged on the screen in form of dashboards.
Environmental Insights
The Sustainable Operations Insights story visualizes emissions information (on plant/facility level) in form of two dashboards:
- Information about emissions to air, water, and land
- Details on greenhouse gas (GHG) emissions
Below you find an impression of what these dashboards look like and what kind of data they display. For more details refer to the sustainable operations insights story in the SAP Help Portal.
Dashboard “Environmental Stewardship”
This dashboard gives an overview of all emissions including waste:
- Emissions to air
- Emissions to water (= wastewater / water discharge)
- Emissions to land (= waste)

Emissions to Air, Water and Land
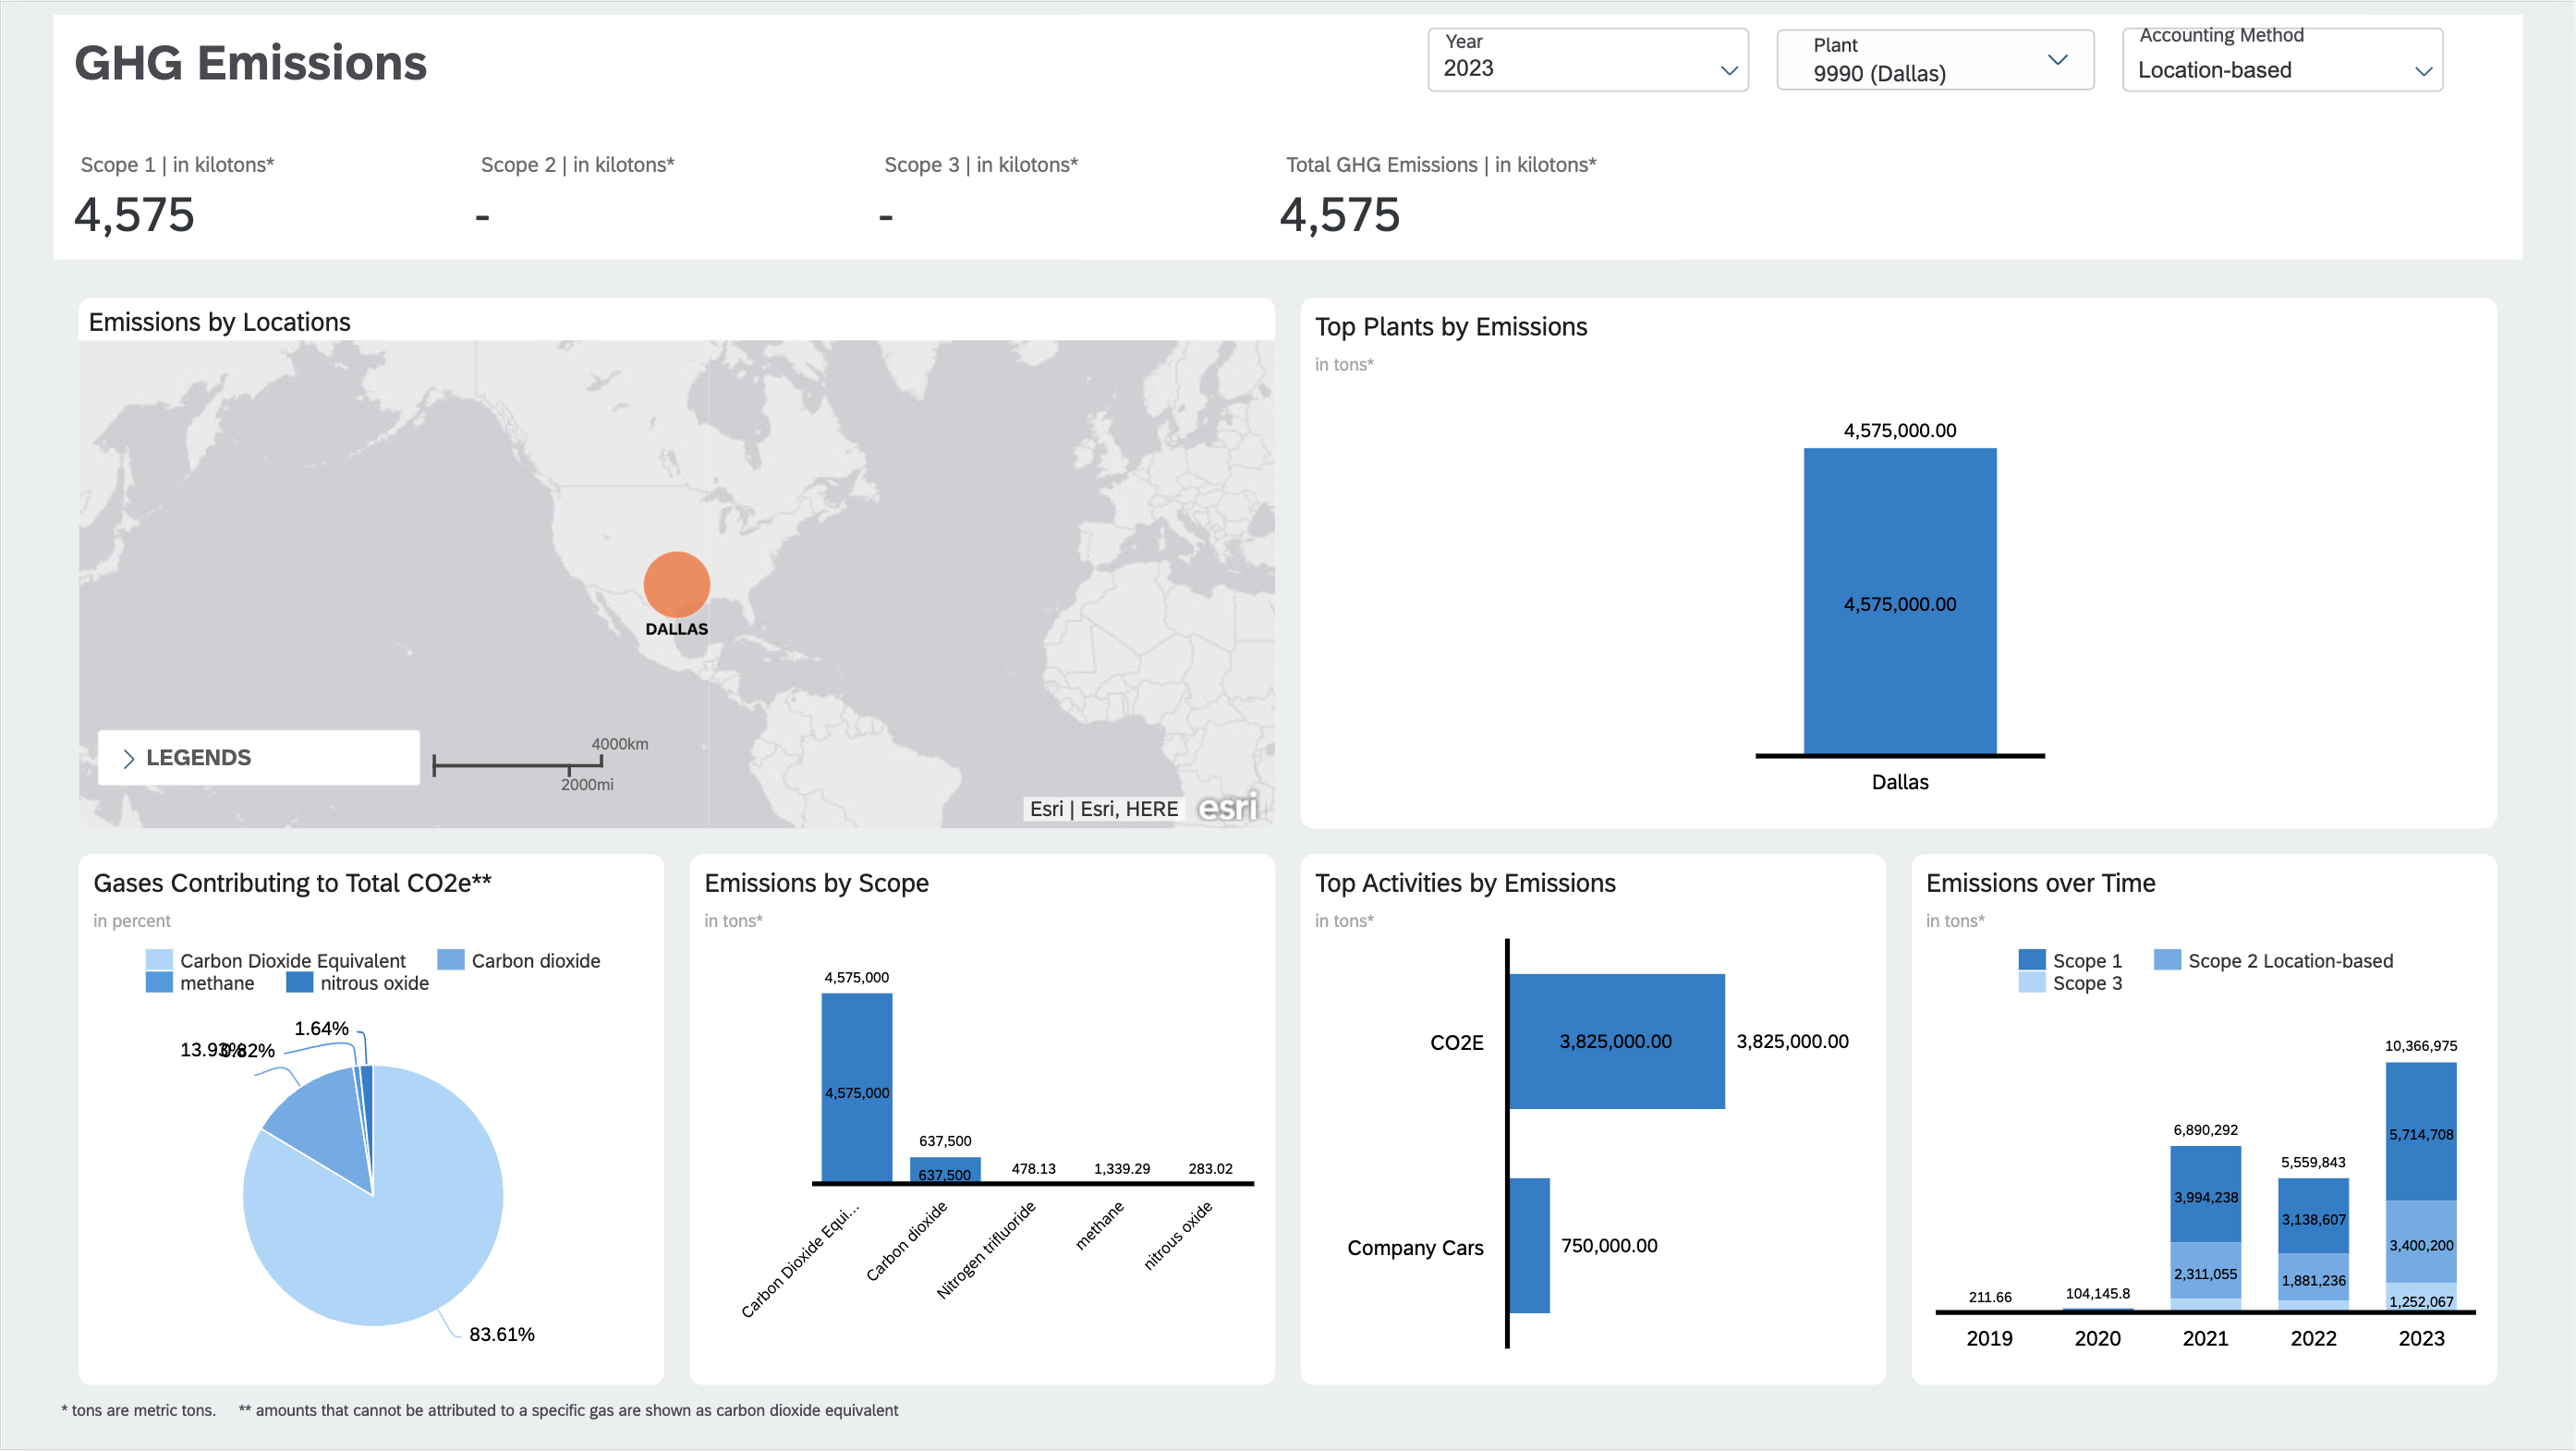
Dashboard “GHG Emissions”
This dashboard goes into details of the special emissions aspect of greenhouse gas (GHG) viewed along several dimensions like for example individual GHG gases, emission scope, or plants.

Greenhouse Gas Emissions
Workplace Safety Insights
Insights into the incident and the risk and hazard situation are in work.
This article offered a quick look at the EHS data insights that are possible with SAP Analytics Cloud. The article intentionally did not go into technical details, as these are described in other places.
For further information see the following SAP Help Portal pages:
Please note that there will also be an additional article containing technical details about architecture and setup of the described scenarios.
如有侵权请联系:admin#unsafe.sh