2023-11-10 22:26:52 Author: blogs.sap.com(查看原文) 阅读量:11 收藏
At the time of composing this blog post, the release of SAP APM in use was 2308, and the version of SAP Data Intelligence being utilized was 2305.
Introduction
Condition-Based Maintenance, or CBM, is a modern maintenance strategy that revolutionizes the way organizations manage their assets. Unlike traditional time-based maintenance, CBM relies on real-time data and advanced technology to monitor an asset’s condition continuously. By doing so, it ensures that maintenance tasks are performed precisely when needed, reducing downtime, cutting costs, improving safety, and extending equipment lifespan. In this blog post, we’ll explore how SAP Asset Performance Management (SAP APM) and SAP Data Intelligence (SAP DI) enable effective CBM implementation, harnessing data and technology for optimized maintenance practices and operational efficiency.
Let’s start with the definition of our approach for CBM. We want to split CBM in the following simple four steps:

Data Acquisition: This initial step involves gathering real-time data from various sensors and monitoring devices attached to the assets. These sensors collect data on parameters such as temperature, pressure, vibration, and more. Data acquisition is crucial because it provides the raw information necessary for assessing the health of assets. On top of data master data and historical maintenance data such as Asset characteristics, breakdowns history can also be acquired to parameterize the next step which is data manipulation.
Data Manipulation: In this pivotal step, collected data is processed and analyzed, ranging from basic to advanced techniques. Data manipulation involves tasks such as data quality assessment, data transformation, data derivation, signal processing (filtering, smoothing, normalization, etc…) ensuring that the data is in a usable format for analysis. While advanced analytics and machine learning algorithms are employed for in-depth analysis, simpler methods can also be utilized to identify patterns, anomalies, and deviations from normal operating conditions. Data manipulation is the bridge between raw data and meaningful assessments of asset health, making it a critical aspect of any CBM strategy.
Health Condition Assessment: In this step, the processed data is used to assess the health condition of the assets. Health condition assessment involves comparing the asset’s current performance against established baselines or thresholds. It helps determine whether an asset is operating within acceptable parameters or if there are signs of deterioration or impending issues. The assessment results guide maintenance decisions, allowing organizations to proactively schedule maintenance tasks based on the actual condition of the asset or to publish a recommendation to keep the asset as healthy as possible.
Maintenance Action and Recommendation: the next logical step is to determine the appropriate maintenance action or recommendation. This step involves using the insights gained from the previous stages to make informed decisions about how to address the identified issues or potential failures. This step is where the proactive nature of CBM shines, as organizations can take timely actions to address asset issues before they escalate, resulting in cost savings and operational efficiency improvements
In our setup we’ll standardize the CBM path into 7 rules/actions:
Rule |
Description |
| 1. Data Quality evaluation | Data is the cornerstone of CBM, Poor data quality can lead to misguided maintenance actions. Data Quality statuses like
should be evaluated to ensure the asset condition is accurately determined. in case data quality is determined as ‘not good’ it makes no sense go through the CBM steps and we would further jump to step 7 |
| 2. Data/Signal pre-treatment |
Signal pre-treatment in CBM is essential as it cleanses raw data of noise and irrelevant information, ensuring that subsequent analysis accurately reflects the true health of the asset and leads to reliable maintenance decisions. |
| 3. Setting the ‘CBM Action Trigger Value’ |
Following the preprocessing of raw data, the next step is to combine correlated data to identify a singular indicator or a composite of indicators that quantify/represent the asset’s condition.. For us, this metric is referred to as the ‘CBM Action Trigger Value‘. |
| 4. Scaling the ‘CBM Action Trigger Value’ to a normalized value |
In an industrial context, we want to handle multiple assets of the same type or even of different types. Each single asset can have is own practical set of thresholds. By normalizing the Action Trigger Value, we can calibrate assets to a uniform scale, facilitating a comprehensive fleet-wide assessment of their condition status. |
| 5. Set The CBM Function Health Status |
This step is the final step of the condition assessment as we will compare the scaled Action Triggered Value with the Normalized Thresholds and establish the condition status. As an example an asset’s condition could be assigned to one of 3 statuses delimited by thresholds: -Below threshold 1 – Status GOOD -Below Threshold 2 – Status ACCEPTABLE -Above Threshold 2 – Status NOT ACCEPTABLE |
| 6. Initiate Maintenance Action |
in case the Health/Condition status of the asset is determined as ‘Bad‘ or ‘Not Acceptable‘ in the previous step, maintenance action should be initiated, such as generating an Alert, Maintenance notification and Maintenance work Order. |
| 7. Initiate Data Quality Action | in case in step 1, the data quality is determined as ‘Not Good’, Action should be taken to re-establish a proper data quality status. Creating a service request to the appropriate service could be a good approach to initiate the action. |
Architecture
To support our CBM application, several architectures can be considered. For this blog spot we’ll take the following 2 assumptions:
- Sensor data (timeseries) are made available within a data lake in the cloud
- The data lake offers APIs to read and consume timeseries data
Therefore a cloud to cloud integration has to be defined to get sensor data into SAP APM. SAP data Intelligence will ensure this integration with a data pipeline between both cloud environment.

Simplified Architecture
The four stages of CBM can be supported by the solution components. The typical design can be achieved as follows:
- Data Acquisition can be competently managed by SAP Data Intelligence. This process involves creating a data pipeline to extract raw data from the data lake, process it, and subsequently channel the relevant information into SAP APM.
- Data manipulation, data quality, and signal pre-treatment can be carried out using SAP Data Intelligence and/or the SAP APM Rules Engine. When dealing with complex data manipulation, signal pre-treatment, or data quality evaluation, it’s more effective to enact the logic in SAP Data Intelligence as part of the data pipeline. However, for tasks of minimal complexity, the APM Rules Engine, especially the Calculation rules, can meet the requirements.
- Health Condition Assessment is a task that may be handled by the APM Rules Engine. This tool is capable of running basic calculations to derive health conditions from other metrics. Additionally, it can meet the demands of conditional controls set against thresholds. This facilitates the generation of alerts and maintenance notifications, particularly when an asset’s health is degraded
- Maintenance Actions and Recommendations can be set into motion once the Health condition is defined as ‘Not Acceptable’. This can result in the emergence of an Alert and/or maintenance notification. The maintenance notification operates within SAP S4HANA Enterprise Asset Management. The correlated maintenance procedures are then administrated through SAP S4HANA EAM. From the insights gained, suggestions for improvements can be proposed at maintenance or equipment level. Such recommendations can be input and managed within the APM recommendation workbench.
Use Case – Filter Condition Monitoring
Now that we have an understanding of our overall architecture and the stages we aim to reach in setting up our CBM application, let’s use a specific case scenario to demonstrate our methodology. Our case scenario, although it is uncomplicated, is often encountered across industries. Our aim is to evaluate the condition of a filter in a pipe which needs to be switched out if it gets excessively dirty.
This filter is supervised by a differential pressure transmitter(IoT). Such methodology ensures that the filter is only replaced when it is necessary. If we were to follow a maintenance approach based on regular time intervals, there’d be a chance that the maintenance work (such as replacing the filter) could either happen too soon or too late, which could consequently have substantial implications on safety, productivity, maintenance costs, and so forth.

Filter and Differential Pressure Transmitter Illustration
In this scenario we’ll monitor the differential pressure, and if it comes too high and alert and maintenance notification will be generated to initiate maintenance action, the filter replacement in this case.
We’re going to handle our 7 CBM rules as follows:
Rule |
Description |
| 1. Data Quality evaluation |
We put this step out of scope for the use case and we take the assumption that the Data Quality is good. in a productive environment we would address the Data Quality status and determine one of these statuses:
|
| 2. Data/Signal pre-treatment |
In our scenario we want to ignore sudden spikes from the raw differential pressure data. These spikes can lead to false positives and then trigger irrelevant maintenance action. To achieve this, we will smooth the raw data using the EWMA approach. |
| 3. Setting the ‘CBM Action Trigger Value’ |
As we have only one timeseries data, the differential pressure, the established EWMA in the previous step becomes the CBM Action Trigger Value. in this scenario we don’t have other data to combine. |
| 4. Scaling the ‘CBM Action Trigger Value’ to a normalized value |
We’re going to normalize the CBM action trigger value to a scale with the following normalized thresholds: 0 – 7 : Status Good 7- 10: Status Acceptable above 10: Status not acceptable |
| 5. Set The CBM Function Health Status | We’re going to compare the Scaled Action Trigger Value with the normalized threshold and therefor establish the current asset condition out of the 3 possibilities |
| 6. Initiate Maintenance Action |
In case the condition status is established as ‘Not Acceptable‘ we’re going to generate an alert and a maintenance notification to trigger maintenance action. |
| 7. Initiate Data Quality Action |
We put it out of scope for this use case. in a productive environment we address a Data Quality issue by creating an alert and sending an Email to appropriate person. On top of this a service request could be created. |
Let’s now deep dive into the details:
We can now examine our filter, which is denoted by a technical object (0001-DPT-100) in SAP APM and corresponds to a functional location in SAP S4HANA. The associated IoT tag is transmitting data from the differential pressure transmitter, and we are able to visualize the data of the last 3 months on the APM indicator chart:

Differential pressure for the last 3 months
In the chart, the differential pressure (DP) is represented with data points every 6 hours. It’s evident that the DP increases over the weeks as the filter becomes increasingly dirty, starting from 0.5 mbar and reaching up to 6 mbar. Additionally, there are noticeable sudden spikes.
We know from the technical object characteristics that the threshold for this filter is 5 mbar.

Technical Object Characteristics
If we overlay the threshold on our DP chart, we observe the DP gradually increase until it meets the threshold and consistently stays above it. Another observation to note is that the peaks clearly exceed the threshold. However, these exceedances are brief, as the peaks are momentary. Thus, if we were to monitor the DP based on the current graph, these peaks would trigger threshold violation Alerts inappropriately. They can definitely be classified as False Positives!

Peaks as False Positive
In signal processing, various strategies can be employed to limit the bad effect of instantaneous peaks. One straightforward method is using smoothing techniques, like EWMA (Exponential Weighted Moving Average). This method minimize the influence of abrupt spikes and significant variations in the original data. For our specific scenario, this technique is well-suited.
We can also delineate three categories to determine the filter’s Health condition based on the smoothed differential pressure:
| Min | Max | Filter Condition |
| 0 | 3.5 | GOOD |
| 3.5 | 5 | ACCEPTABLE |
| 5 | infinite | NOT ACCEPTABLE – Maintenance action required |

DP EWMA vs DP Raw Data
When we overlay the EWMA (green curve) on the chart, the DP trend becomes evident, and the abrupt spikes that might trigger false alerts are no longer present in that curve.
How and where can we calculate the EWMA ?
The equation to compute the EWMA for time series data is straightforward:
where ALPHA (α) is the smoothing factor. Remember that ALPHA is maintained as a characteristic of the technical object. Another possibility would have been to maintain ALPHA as an attribute of the indicator, directly in SAP APM Indicator configuration. The EWMA is a recursive function, which means that the current observation is calculated using the previous observation.
Given the simplicity of this computation, we have two options for determining the EWMA. We can integrate the calculation directly into the data pipeline within SAP Data Intelligence. Alternatively, we can utilize the SAP APM Rules Engine to perform the EWMA computation within its calculation rules.
For any complex calculation, SAP Data Intelligence should be considered. For this scenario we’ll opt for SAP Data Intelligence to compute the EWMA directly within the data pipeline (even if it is also feasible in SAP APM rule Engine).
we’ll see later how to use the rules engine to compute a scaled version of our EWMA 😉
Earlier in this blog post on condition-based maintenance, we highlighted the dual roles of SAP Data Intelligence: firstly, to configure the time series data pipeline, and secondly, to harness this pipeline for data manipulation and derivation, providing the insights needed to evaluate the condition of a technical object. SAP Data Intelligence provides a visual interface for constructing these pipelines.
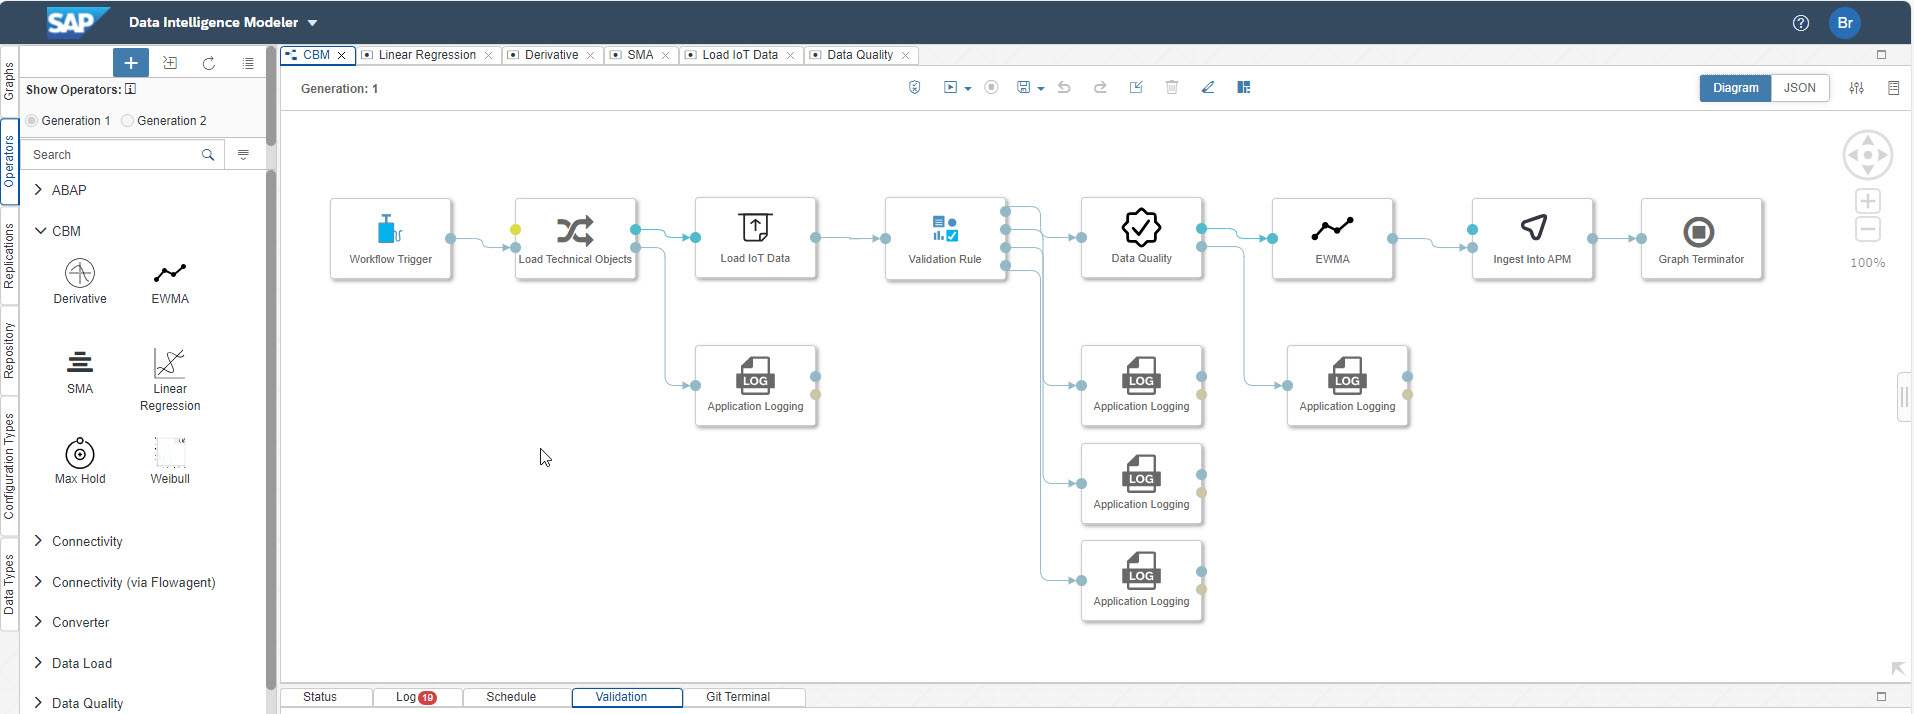
Here’s a visual representation of our data pipeline:

SAP Data Intelligence Pipeline
In this SAP DI Graph, the workflow progresses from the left to the right. Initially, relevant technical objects are extracted from either SAP APM or SAP S4HANA. For our configuration, the essential information needed to access the appropriate time series and implement data manipulation is stored within the technical object’s characteristics
The next move after retrieving technical objects is to pull time series data from our data lake via an API. Once we have this data, the logical next step is data manipulation. However, it’s essential to run a data validation check. This ensures everything is on track, especially since a simple oversight, like a missing characteristic value, can potentially derail our data handling process.
Our setup considers just a single data manipulation action: computing the EWMA from raw data. While we’ve kept it simple here, multiple data manipulation operations can be conducted either concurrently or sequentially. The EWMA operator visible on the graph is a custom operator crafted using Python. The beauty of this operator is its reusability, allowing it to be integrated into various data pipelines. These operators come with customizable input and output parameters, enhancing their flexibility. By standardizing the use of such operator, there’s an opportunity to establish a library of reusable operators for tasks ranging from EWMA and SMA to Max Hold Algorithm, skewness, kurtosis, linear regression, Weibull Distribution, and much more.

Data Manipulation with standard and specific reusable operators
With the EWMA now computed, the dataset progresses to its final stage: data ingestion into SAP APM. SAP APM provides APIs specifically designed for time series data ingestion. Within SAP APM, the entities that receive this time series data are called “Indicators,” which are then linked to the respective technical object.
This is then how a data pipeline can look like in SAP DI, however while our pipeline could include features like robust Data Quality Assessment or execution logs management, very important in a productive setup, we kept it out of scope for our scenario as we’re focusing on the filter condition assessment.
To wrap up our overview of the SAP DI configuration, the final step involves setting the pipeline to run at regular intervals, such as every 6 hours, given that real-time data ingestion isn’t a requirement for our scenario.
Scaling the controlled indicator to get a Fleet overview, even for different equipment types !
This setup is ideal for one filter, but in industrial contexts, we often monitor multiple equipments. Different filters can have varied pressure thresholds based on their use and location. For instance, while our filter has a 5 mbar threshold, another in the same plant might be set at 8 mbar or some other value.
To standardize the overview of the equipment fleet, it’s essential to align the control indicators (like the EWMA in our case) to a common scale. This approach offers the benefits of:
- Placing all technical items on a unified platform for analysis and comparison.
- Using a single rule check for all technical items with identical monitoring configurations.
To achieve this, we can adjust the filter’s operational range to the standardized scale and then apply it to the EWMA value.
To put it concretely:
To determine the scaling factor, you can base it on the desired scaled operating range and the current filter operating range. Suppose we aim to adjust our indicator within a scaled range of 0 to 10. Given our parameters:
- Filter operating range: 0 to 5
- Scaled Operating Range: 0 to 10
The formula for the scaling factor is:
Using our data, the scaling factor is:
![]()
With this factor, the scaled EWMA value can be derived using:
![]()
For an EWMA value of 3.5, the calculation is:
![]()
In our scenario, the indicator displaying this Scaled EWMA is called “Scaled Action Trigger Value“.
This indicator is going to be the controlled indicator against the scaled operating range and related threshold.
The Scaled indicator should have a generic unit of measure that we can call Engineering Unit.
This approach allows to normalize the equipment fleet overview even for different equipment types.
in our our example this is how the scaled EWMA (or Scaled Action Trigger Value) looks like with the related scaled thresholds:

Scaled Thresholds – valid of equipment fleet overview

Scaled Action Trigger Value curve with Scaled threshold
Adding this Scaled Action Trigger Value indicators to our technical gives the following 3 indicators for the Filter CBM Setup:

Indicators for Filter Condition Monitoring
The Differential Pressure is the raw data coming from the physical asset through the data pipeline
The EWMA is calculated within the data pipeline
the Scaled action Trigger Values is calculated in the SAP APM rule Engine.
The setup of such a calculation rule for the Scaled Action Trigger Value is as follows:

APM Calculation Rule

Rules overview with status and last execution timestamp
Set up a rule to check the scaled indicator against the threshold.
We now have the data needed to evaluate our filter’s condition. The only remaining task is to establish a rule that triggers an alert and/or notification when the Scaled Action Trigger Value hits the designated threshold.
The first step is to define the alert type that materialize the ‘Not Acceptable’ condition.

Alert Type with Severity Error – Deduplication active for 15 days
Having the alert type ready the control rule can be defined as followed:

Streaming Rule that controls the Scaled Action Trigger Value and generate an Alert and Notification in case of Threshold violation
The alert can be displayed on the indicator chart:
Alert displayed on indicator chart
And with the Alert Monitoring App our alert can be displayed and managed:

Alert Monitoring
In the details of the Alert monitoring, alert status can be managed, notification can be created if not yet done, and subsequent indicators can be analyzed on the indicator chart when the alert occurred.

Alert details – subsequent indicators analyses
Conclusion:
Our CBM system identified a ‘Not Acceptable’ condition for the filter labeled 0001-DPT-100 on October 2, 2023. A corresponding alert and Maintenance Notification were promptly issued. It is now the responsibility of the maintenance manager to address the issue and restore the filter to proper working condition. In this instance, the necessary action involves replacing the filter. The notification, potentially accompanied by an associated task list, has been generated in SAP S4HANA EAM and is prepared to be converted into a work order.
Having the CBM setup running, the calendar based maintenance plan can be removed as CBM ensures that we perform the maintenance activities precisely when needed, avoiding premature or delayed maintenance.
Acknowledgement:
The CBM concept and use case outlined in this blog spot has been inspired from the CBM design established by a major Oil & gas/Energy company in Norway. I would like to express my gratitude to the maintenance engineers who provided their significant contributions that shaped the creation of this blog post.
See you soon for an other CBM use case !
如有侵权请联系:admin#unsafe.sh