How to monitor DTU on SAP Commerce Cloud lower environments
2023-11-8 15:54:53 Author: blogs.sap.com(查看原文) 阅读量:6 收藏
2023-11-8 15:54:53 Author: blogs.sap.com(查看原文) 阅读量:6 收藏
On production environment, you can check database DTU size and monitor usage with standard Dynatrace dashboards.
Here is an example from SAP – Infra Usage dashboard.

These metrics do not work on lower environment (dev or stage).
In this article, we will explain how to create a dedicated dashboard for this.
Manually create the dashboard
Here are the instructions to create a new dashboard to monitor DTU on lower environment.
- Connect to Dynatrace on the lower environment
- Go to Dashboard > Create Dashboard
- Enter Dashboard Name: “SAP – DTU monitoring”
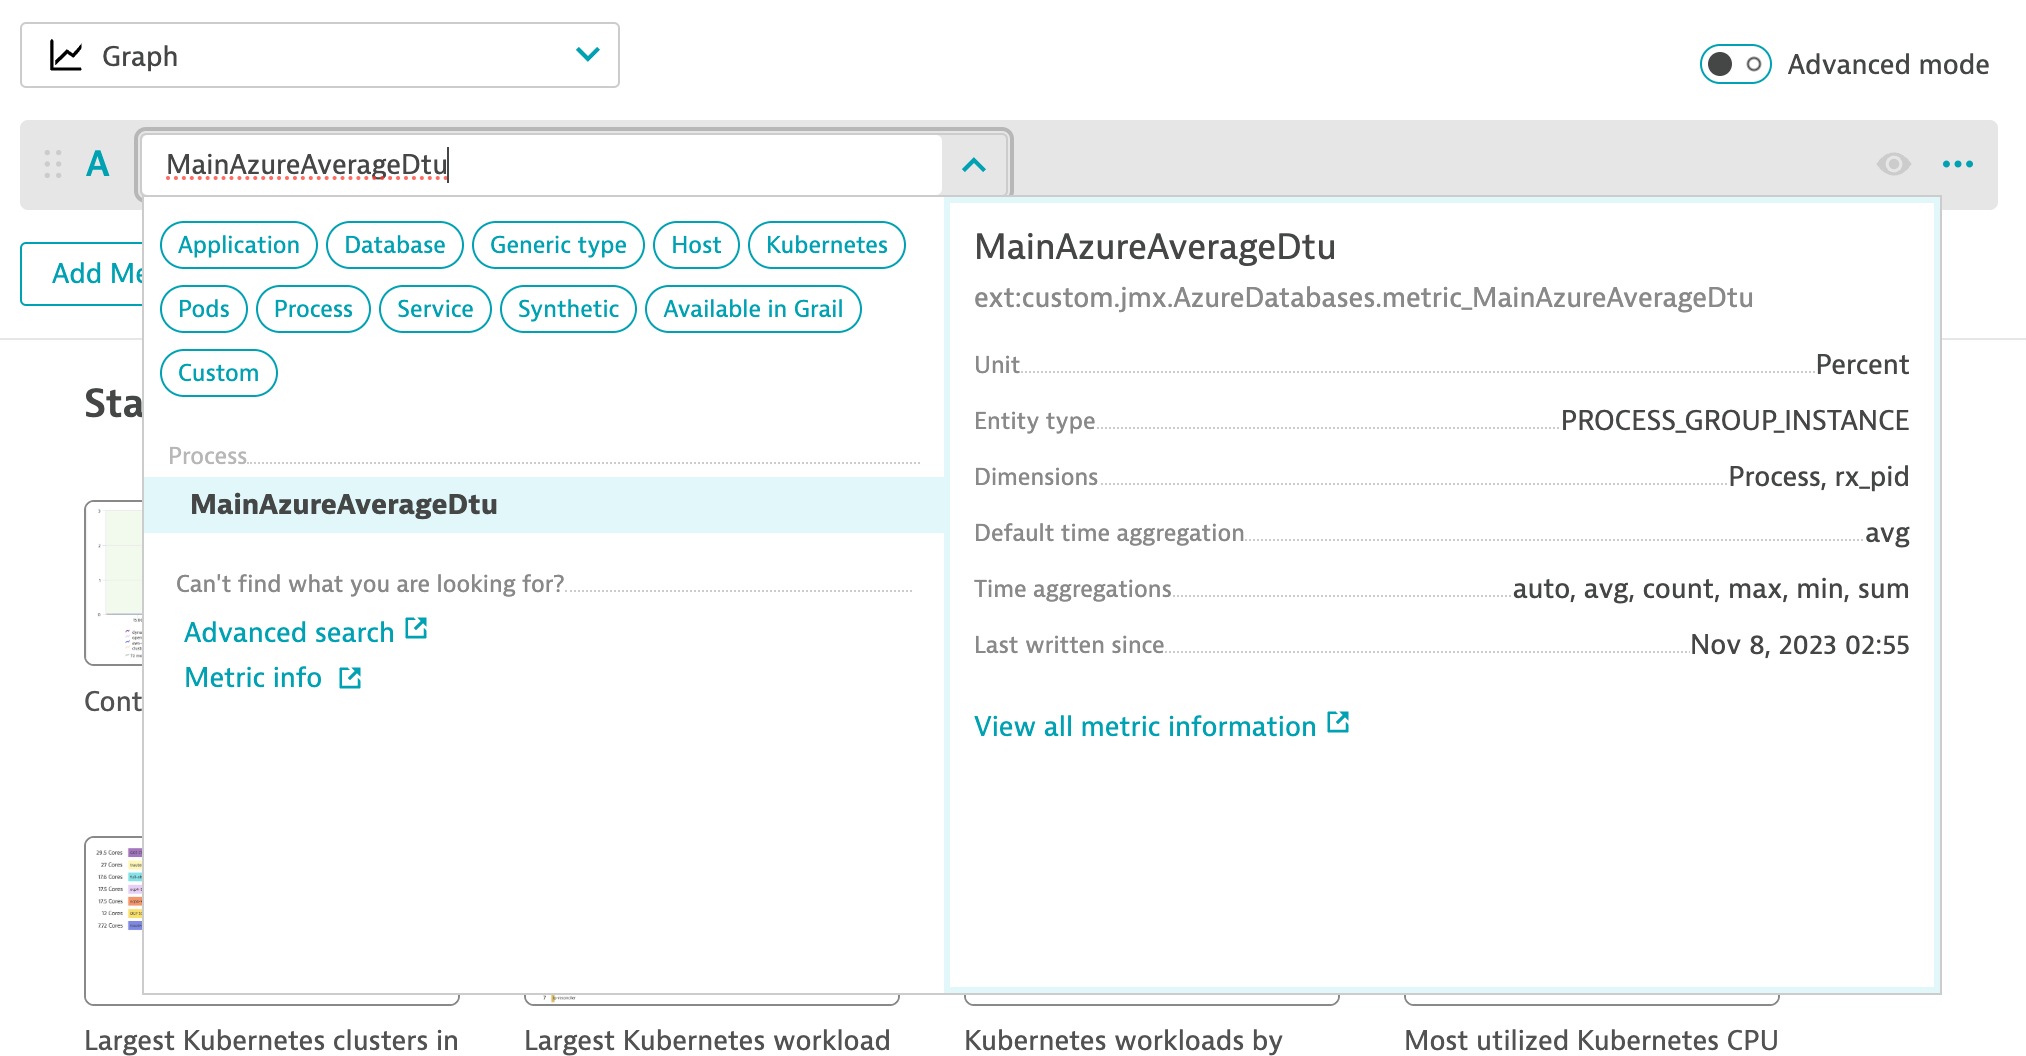
- Add two graphs, one called “DTU usage” and another one called “DTU size”

- For DTU usage, add the metric “MainAzureAverageDtu” and click Saves changes to dashboard

- For DTU size, add the metric “iops.azure.DB.DTU”
- Please note, this metric provides only one data point per day so to have a straight line, enable connected gaps

Here is the result:

Import the dashboard
If you want to quickly create the dashboard, you can also import the following JSON file into Dynatrace.
{
  "metadata": {
    "configurationVersions": [
      7
    ],
    "clusterVersion": "1.276.258.20231023-170203"
  },
  "id": "5c26ee8c-d8b4-4d5a-b36c-35ebb90647bf",
  "dashboardMetadata": {
    "name": "SAP - DTU monitoring",
    "shared": false,
    "owner": "i303937",
    "hasConsistentColors": false
  },
  "tiles": [
    {
      "name": "DTU usage",
      "tileType": "DATA_EXPLORER",
      "configured": true,
      "bounds": {
        "top": 38,
        "left": 0,
        "width": 950,
        "height": 342
      },
      "tileFilter": {},
      "isAutoRefreshDisabled": false,
      "customName": "Data explorer results",
      "queries": [
        {
          "id": "A",
          "metric": "ext:custom.jmx.AzureDatabases.metric_MainAzureAverageDtu",
          "spaceAggregation": "AUTO",
          "timeAggregation": "DEFAULT",
          "splitBy": [],
          "sortBy": "DESC",
          "sortByDimension": "",
          "filterBy": {
            "nestedFilters": [],
            "criteria": []
          },
          "limit": 20,
          "rate": "NONE",
          "enabled": true
        }
      ],
      "visualConfig": {
        "type": "GRAPH_CHART",
        "global": {},
        "rules": [
          {
            "matcher": "A:",
            "properties": {
              "color": "DEFAULT"
            },
            "seriesOverrides": []
          }
        ],
        "axes": {
          "xAxis": {
            "displayName": "",
            "visible": true
          },
          "yAxes": [
            {
              "displayName": "",
              "visible": true,
              "min": "AUTO",
              "max": "AUTO",
              "position": "LEFT",
              "queryIds": [
                "A"
              ],
              "defaultAxis": true
            }
          ]
        },
        "heatmapSettings": {
          "yAxis": "VALUE",
          "showLabels": false
        },
        "singleValueSettings": {
          "showTrend": true,
          "showSparkLine": true,
          "linkTileColorToThreshold": true
        },
        "thresholds": [
          {
            "axisTarget": "LEFT",
            "rules": [
              {
                "color": "#7dc540"
              },
              {
                "color": "#f5d30f"
              },
              {
                "color": "#dc172a"
              }
            ],
            "visible": true
          }
        ],
        "tableSettings": {
          "hiddenColumns": []
        },
        "graphChartSettings": {
          "connectNulls": false
        },
        "honeycombSettings": {
          "showHive": true,
          "showLegend": true,
          "showLabels": false
        }
      },
      "queriesSettings": {
        "resolution": ""
      },
      "metricExpressions": [
        "resolution=null&(ext:custom.jmx.AzureDatabases.metric_MainAzureAverageDtu:splitBy():sort(value(auto,descending)):limit(20)):limit(100):names"
      ]
    },
    {
      "name": "DTU Size",
      "tileType": "DATA_EXPLORER",
      "configured": true,
      "bounds": {
        "top": 380,
        "left": 0,
        "width": 950,
        "height": 304
      },
      "tileFilter": {},
      "isAutoRefreshDisabled": false,
      "customName": "Data explorer results",
      "queries": [
        {
          "id": "A",
          "metric": "iops.azure.DB.DTU",
          "spaceAggregation": "AUTO",
          "timeAggregation": "DEFAULT",
          "splitBy": [],
          "sortBy": "DESC",
          "sortByDimension": "",
          "filterBy": {
            "nestedFilters": [],
            "criteria": []
          },
          "limit": 20,
          "rate": "NONE",
          "enabled": true
        }
      ],
      "visualConfig": {
        "type": "GRAPH_CHART",
        "global": {
          "hideLegend": false
        },
        "rules": [
          {
            "matcher": "A:",
            "unitTransform": "auto",
            "valueFormat": "auto",
            "properties": {
              "color": "YELLOW",
              "seriesType": "LINE"
            },
            "seriesOverrides": []
          }
        ],
        "axes": {
          "xAxis": {
            "displayName": "",
            "visible": true
          },
          "yAxes": [
            {
              "displayName": "",
              "visible": true,
              "min": "AUTO",
              "max": "AUTO",
              "position": "LEFT",
              "queryIds": [
                "A"
              ],
              "defaultAxis": true
            }
          ]
        },
        "heatmapSettings": {
          "yAxis": "VALUE",
          "showLabels": false
        },
        "singleValueSettings": {
          "showTrend": true,
          "showSparkLine": true,
          "linkTileColorToThreshold": true
        },
        "thresholds": [
          {
            "axisTarget": "LEFT",
            "rules": [
              {
                "color": "#7dc540"
              },
              {
                "color": "#f5d30f"
              },
              {
                "color": "#dc172a"
              }
            ],
            "visible": true
          }
        ],
        "tableSettings": {
          "hiddenColumns": []
        },
        "graphChartSettings": {
          "connectNulls": true
        },
        "honeycombSettings": {
          "showHive": true,
          "showLegend": true,
          "showLabels": false
        }
      },
      "queriesSettings": {
        "resolution": "1h"
      },
      "metricExpressions": [
        "resolution=1h&(iops.azure.DB.DTU:splitBy():sort(value(auto,descending)):limit(20)):limit(100):names"
      ]
    }
  ]
}
文章来源: https://blogs.sap.com/2023/11/08/how-to-monitor-dtu-on-sap-commerce-cloud-lower-environments/
如有侵权请联系:admin#unsafe.sh
如有侵权请联系:admin#unsafe.sh