In my previous blog, I introduced the Edge Integration Cell, EIC in short, explaining what it is about and what the typical use cases are. It was written from a deploy & monitor perspective. This blog is to give you an idea how it looks like and what you can expect to see. It was written from an EIC management perspective.
It all starts, after installation and configuration (more of that in an additional blog), with an additional runtime, next to the native one.

Now, you entered the Edge Lifecycle Management part. It consists of mainly 3 parts
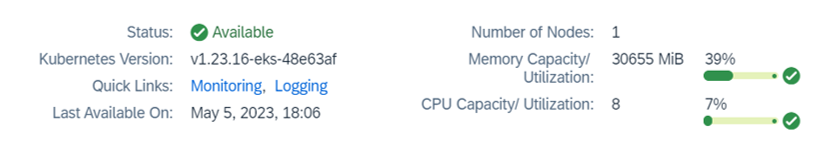
General – it gives you a brief high level overview of how the edge node is performing. It also provides quick links to the monitoring and logging part.

Diagnostics data – collect diagnostics to perform root cause analysis or to send to SAP for further analysis.
Deployments – make sure the EIC is deployed properly, check the configuration and perform necessary upgrades.

Within the general part, detailed monitoring and logging is available (see links in the screenshot above). When you click on the monitoring link, an additional screen will pop up, showing al lot of runtime data. The screenshots below just indicate a part of it, to give you an idea how it looks like and what you can expect.

Besides the monitoring part, there is also logging available. If you, e.g., need to understand if a specific interface reaches the EIC, you can find it here. The logging part provides a very very detailed view on the in and outs of your edge node.

如有侵权请联系:admin#unsafe.sh