2023-10-20 00:10:41 Author: blogs.sap.com(查看原文) 阅读量:10 收藏
One important point in Transportation management are the KPI’s which help the Key User to performance the analytics in the Job.
SAP TM have standard Fiori called overview pages. (That is different from the Worklist, which is use in other context to daily execution, etc., but also help to have some indicators).
The analytics in TM are available for this process:
- Allocation Analysis
- Business Share Analysis
- Cost Analysis
- Freight Booking Execution Monitoring
- Freight Booking Quantity Analysis
- Freight Order Execution Monitoring
- Freight Order Quantity Analysis
- Tendering Analysis
All the analytics is based on CDS views which is real time information available for the Key user.

I will focus on the Cost analysis which is my favorite because give a lot of interested Indicators.

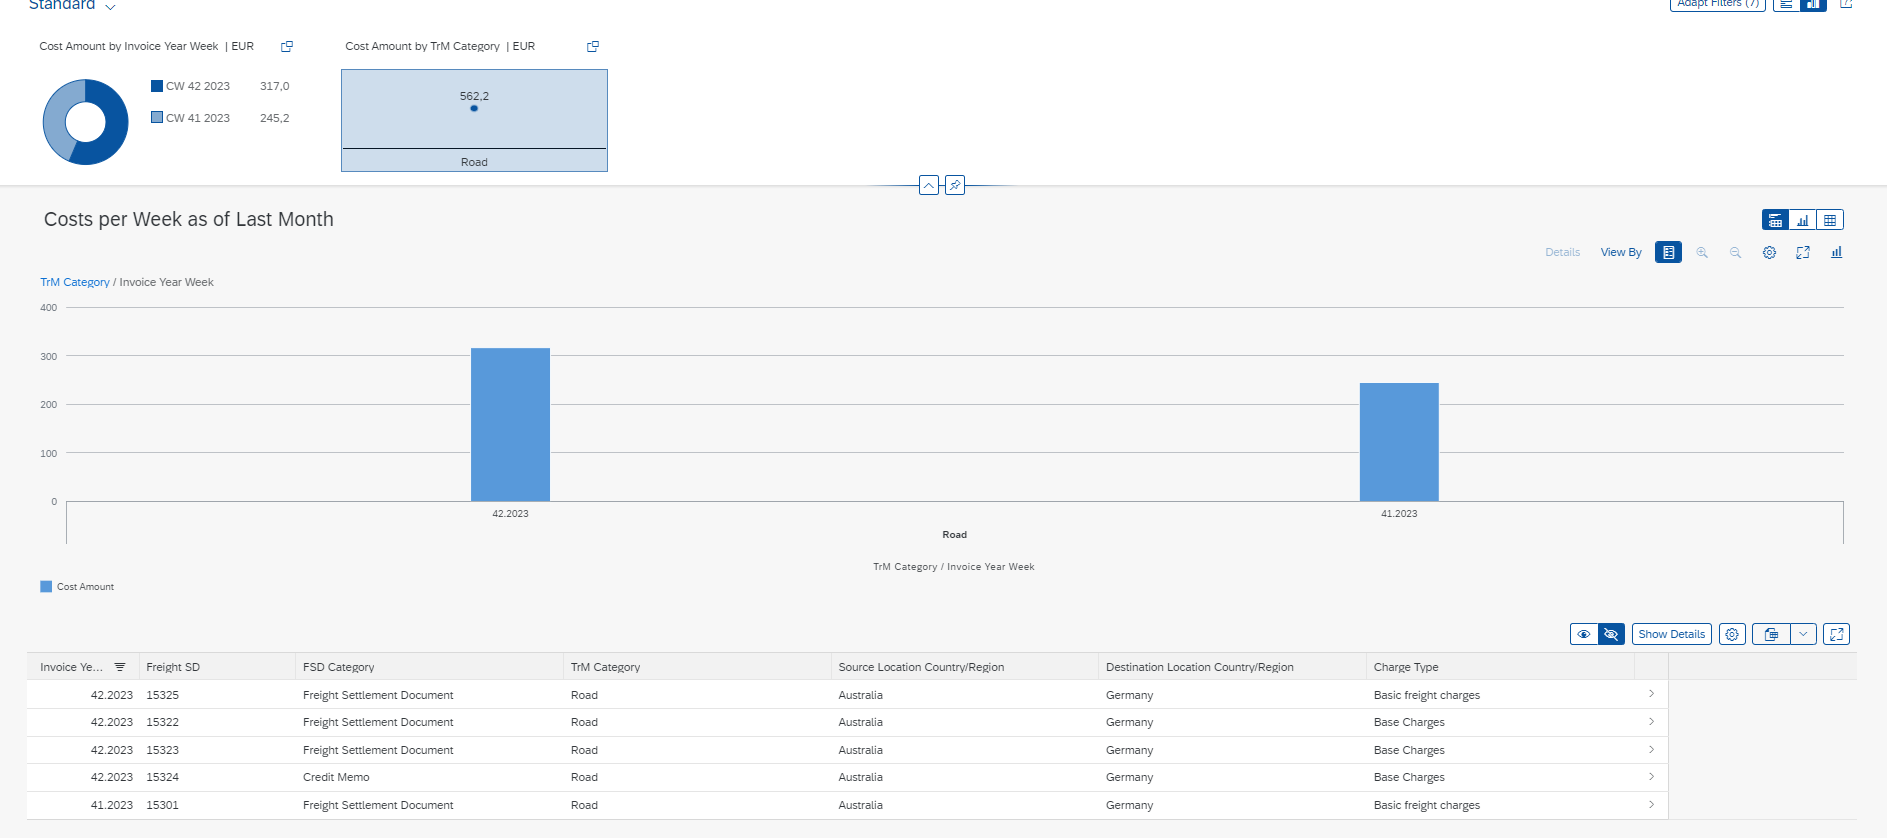
In this example you can see the cost by transport mode and the relevant documents (Not all Card use the same Document basis, this example is based on FSD).

All card you can use the Chart type with different views.

Also, you can adopt the filters to have other selection criteria and columns.

You can send direct from the Fiori by email or download it to excel.
I see many projects which Consultant has not explore this KPI’s and the possibilities around to use the standard functionalities of TM.
I know in each project KPI’s can be different but if you go to use development explore the same approach SAP uses for the analytics isn’t develop based on tables, etc.
Check the follow Oss Notes in each of them there is attachments explain, how it is developed, which filters, status, time range are the values for each Fiori/card.
2779334 – Change of Time Filter with a Metadata Extension for TM Analytics CDS
2960393 – Data display in Transportation Management Analytics – Overview Pages
3243363 – Change of Parameters for Unit of Measure and Currency with a Metadata Extension for TM Analytics CDS
More Oss note are available under the components: TM-CF-ANA / TM-CF-ANA-FIO
Hope that can help you.
Thanks and regards
Rogerio Lima.
如有侵权请联系:admin#unsafe.sh