Introduction
With the reference to my previous blog on D3’s map (link below):
https://blogs.sap.com/2023/09/20/d3-visualization-map-in-sap-fiori-app/
I thought of writing this blog on “Bubble Chart in UI5″, I followed the similar coding style here, where I have locally stored the data in model and building the chart using custom control.
Bubble Chart’s code & its sample test data I have referred from below link:
https://observablehq.com/@d3/bubble-chart/2?intent=fork
Environment:
- SAP Web IDE Full-Stack
Result:
Final output in UI5 will look as below:

Technical Code:
I am not following here step by step approach on how to create app, view, controller etc., because it will make the blog long, so summarizing technical details as below:
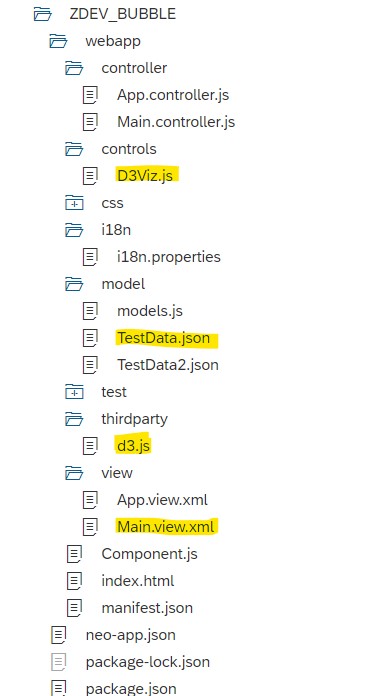
App technical name is : “ZDEV_BUBBLE” with below folder structure :

Where,
model(folder) contains data;
- “TestData.json” : It contains data in below format, where we have only two fields; “id” & “value”
[{
"id": "flare.analytics.cluster.AgglomerativeCluster",
"value": 3938
}, {
"id": "flare.analytics.cluster.CommunityStructure",
"value": 3812
},
....
}]
in “id” we can have our own custom values for example : “2023.Material Group.Material Name”
Other than standard folder structure we have created two additional folders below:
- “controls” – this folder contains custom control JavaScript coding for implementing bubble chart
- “thirdparty” – this folder contains the JavaScript libraries d3.js
Note:
- Get data logic and bubble chart related logic is written in custom control & main view only the complete code snippet of the view and custom control is copied below
- Test data and JS libraries you can get from below link:
https://observablehq.com/@d3/bubble-chart/2?intent=fork
Main.view:
<mvc:View
	controllerName="ns.ZDEV_BUBBLE.controller.Main"
	xmlns:mvc="sap.ui.core.mvc"
	displayBlock="true"
	xmlns="sap.m"
	xmlns:core="sap.ui.core"
	xmlns:controls="ns.ZDEV_BUBBLE.controls"
	xmlns:base="sap.ui.base">

	<Page id="page" title="{i18n>title}">
	    <controls:D3Viz data="{/ui5con}">
	      <controls:data>
	        <base:ManagedObject />
	      </controls:data>
	    </controls:D3Viz>
	</Page>

</mvc:View>
Custom Control (D3Viz.js):
sap.ui.define([
	"sap/ui/core/Control",
	"sap/ui/core/HTML",
	"sap/ui/core/ResizeHandler",
	"sap/ui/model/json/JSONModel",
	"jquery.sap.global",
	"ns/ZDEV_BUBBLE/thirdparty/d3"

], function (Control, HTML, ResizeHandler, JSONModel, jQuery) {
	"use strict";

	return Control.extend("ns.ZDEV_BUBBLE.controls.D3Viz", {

		metadata: {
			aggregations: {
				_html: {
					type: "sap.ui.core.HTML",
					multiple: false,
					visibility: "hidden"
				},
				data: {
					type: "sap.ui.base.ManagedObject"
				}
			}
		},

		init: function () {
			this._sContainerId = this.getId() + "--container"
			this.setAggregation("_html", new HTML({
				content: "<svg id='" + this._sContainerId + "'></svg>"
			}))
		},

		exit: function () {
			ResizeHandler.deregister(this._sResizeHandlerId);
		},

		renderer: {
			apiVersion: 2,
			render: function (oRm, oControl) {
				oRm.openStart('div', oControl);
				oRm.openEnd();
				oRm.openStart('p').openEnd();
				oRm.close('p');
				oRm.renderControl(oControl.getAggregation('_html'));
				oRm.close('div');
			}
		},

		_onResize: function () {
			this._renderViz();
		},

		onBeforeRendering: function () {
			ResizeHandler.deregister(this._sResizeHandlerId);
		},

		onAfterRendering: function () {
			this._sResizeHandlerId = ResizeHandler.register(this, this._onResize.bind(this));
			this._renderViz();
		},

		_renderViz: function () {

			const height = 600;
			const width = this.$().width();

			//Select container
			const svg = d3.select('#' + this._sContainerId);
			svg.attr("height", height).attr("width", width);
			svg.attr("style", "max-width: 100%; height: auto; font: 10px sans-serif;");
			svg.attr("text-anchor", "middle");

			var oModel = new JSONModel();
			var sPath = jQuery.sap.getModulePath("ns.ZDEV_BUBBLE", "/model/TestData.json");

			jQuery.ajax({
				url: sPath,
				dataType: "json",
				async: false, // Synchronous loading for simplicity (not recommended in production)
				success: function (oData, res) {

					const data = oData;

					/**
					 * The following snippet is based on the Bubble Chart of Mike Bostock
					 * https://observablehq.com/@d3/bubble-chart
					 */
					const margin = 1; // to avoid clipping the root circle stroke
					const name = d => d.id.split(".").pop(); // "Strings" of "flare.util.Strings"
					const group = d => d.id.split(".")[1]; // "util" of "flare.util.Strings"
					const names = d => name(d).split(/(?=[A-Z][a-z])|\s+/g); // ["Legend", "Item"] of "flare.vis.legend.LegendItems"

					// Specify the number format for values.
					const format = d3.format(",d");

					// Create a categorical color scale.
					const color = d3.scaleOrdinal(d3.schemeTableau10);

					// Create the pack layout.
					const pack = d3.pack()
						.size([width - margin * 2, height - margin * 2])
						.padding(3);

					// Compute the hierarchy from the (flat) data; expose the values
					// for each node; lastly apply the pack layout.
					const root = pack(d3.hierarchy({
							children: data
						})
						.sum(d => d.value));

					// Place each (leaf) node according to the layout’s x and y values.
					const node = svg.append("g")
						.selectAll()
						.data(root.leaves())
						.join("g")
						.attr("transform", d => `translate(${d.x},${d.y})`);

					// Add a title.
					node.append("title")
						.text(d => `${d.data.id}\n${format(d.value)}`);

					// Add a filled circle.
					node.append("circle")
						.attr("fill-opacity", 0.7)
						.attr("fill", d => color(group(d.data)))
						.attr("r", d => d.r);

					// Add a label.
					const text = node.append("text")
						.attr("clip-path", d => `circle(${d.r})`);

					// Add a tspan for each CamelCase-separated word.
					text.selectAll()
						.data(d => names(d.data))
						.join("tspan")
						.attr("x", 0)
						.attr("y", (d, i, nodes) => `${i - nodes.length / 2 + 0.35}em`)
						.text(d => d);

					// Add a tspan for the node’s value.
					text.append("tspan")
						.attr("x", 0)
						.attr("y", d => `${names(d.data).length / 2 + 0.35}em`)
						.attr("fill-opacity", 0.7)
						.text(d => format(d.value));

				},
				error: function (err) {
					console.log(err); // Handle the error if loading fails
				}
			});

		} // end of onAfterRendering

	});
});
I hope this blog will help others to implement D3 charts/maps with the help of custom control in UI5 with less efforts.
I welcome any suggestion or improvements for the code and other feedback.
Thank you.
Regards,
Masoom Ahmad
如有侵权请联系:admin#unsafe.sh