Loading...

In preparation of Cloudflare Speed Week 2023, we spent the last few weeks benchmarking the performance of a Cloudflare product that has gone through many transformations throughout the years: the Cloudflare dashboard itself!
Limitations and scope
Optimizing for user-experience is vital to the long-term success of both Cloudflare and our customers. Reliability and availability of the dashboard are also important, since millions of customers depend on our services every day. To avoid any potential service interruptions while we made changes to the application’s architecture, we decided to gradually roll out the improvements, starting with the login page.
As a global company, we strive to deliver the best experience to all of our customers around the world. While we were aware that performance was regional, with regions furthest from our core data centers experiencing up to 10 times longer loading speeds, we wanted to focus on improvements that would benefit all of our users, no matter where they geographically connect to the Dashboard.
Finally, throughout this exercise, it was important to keep in mind that our overall goal was to improve the user experience of the dashboard, with regards to loading performance. We chose to use a Lighthouse Performance score as a metric to measure performance, but we were careful to not set a target score. Once a measure becomes a target, it ceases to be a good measure.
Initial Benchmarks
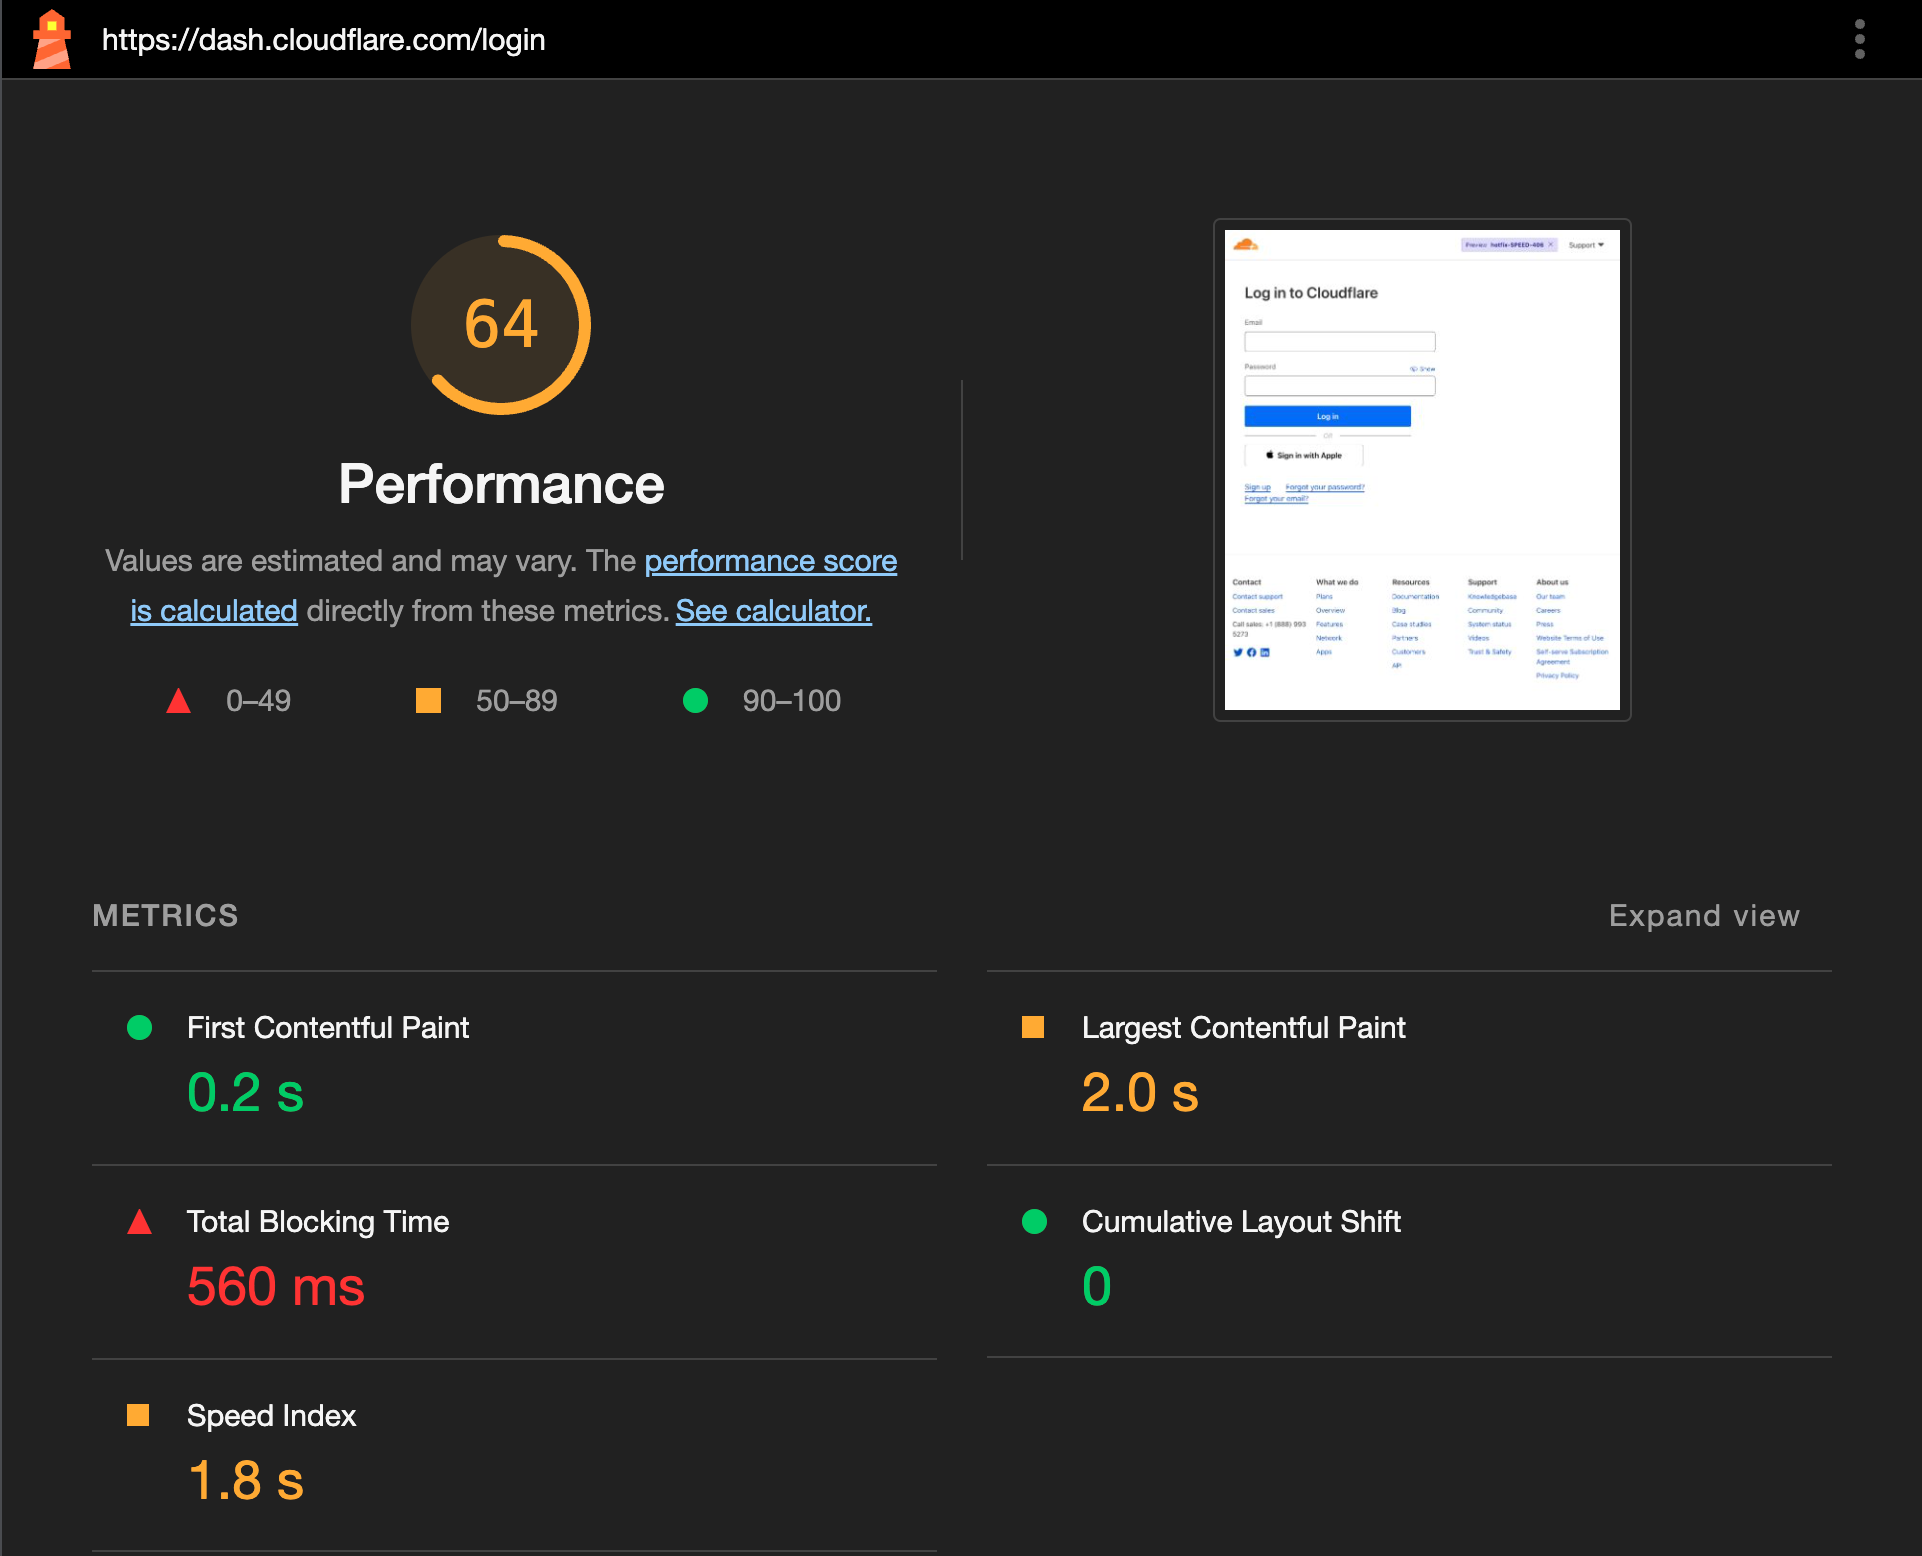
Using a combination of open-source tools offered by Google (Lighthouse and PageSpeed Insights) and our own homegrown solution (Cloudflare Speed Test), we benchmarked our Lighthouse performance scores starting in Q1 2023. We found the results were… somewhat disappointing:
- Although the site’s initial render occurred quickly (200ms), it took more than two seconds for the site to finish loading and be fully interactive.
- In that time, the page was blocked for more than 500ms while the browser executed long JavaScript tasks.
- Over half of the JavaScript served for the login page was not necessary to render the login page itself.

Improving what we've measured
The Cloudflare dashboard is a single page application that houses all of the UI for our wide portfolio of existing products, as well as the new features we're releasing every day. However, a less-than-performant experience is not acceptable to us; we owe it to our customers to deliver the best performance possible.
So what did we do?
Shipped less JavaScript
As obvious as it sounds, shipping less code to the user means they have to download fewer resources to load the application. In practice however, accomplishing this was harder than expected, especially for a five year old monolithic application.
We identified some of our largest dependencies with multiple versions, like lodash and our icon library, and deduped them. Bloated packages like the datacenter colo catalogs were refactored and drastically slimmed down. Packages containing unused code like development-only components, deprecated translations, and old Cloudflare Access UI components were removed entirely.
The result was a reduction in total assets being served to the user, going from 10MB (2.7MB gzipped) to 6.5MB (1.7MB gzipped). Lighthouse performance score improved to about 70. This was a good first step, but we could do better.
Identified and code split top-level boundaries
Code splitting is the process in which the application code is split into multiple bundles to be loaded on demand, reducing the initial amount of JavaScript a user downloads on page load. After logging in, as users navigate from account-level products like Workers and Pages, and then into specific zone-level products, like Page Shield for their domain, only the code necessary to render that particular page gets loaded dynamically.
Although most of the account-level and zone-level pages of the dashboard were properly code-split, the root application that imported these pages was not. It contained all of the code to bootstrap the application for both authenticated and unauthenticated users. This wasn’t a great experience for users who weren't even logged in yet, and we wanted to allow them to get into the main dashboard as quickly as possible.
So we split our monolithic application into two sub-applications: an authenticated and unauthenticated application. At a high level, on entrypoint initialization, we simply make an API request to check the user’s authentication state and dynamically load one sub-application or the other.
import React from 'react';
import { useAuth } from './useAuth';
const AuthenticatedAppLoadable = React.lazy(
  () => import('./AuthenticatedApp')
);
const UnauthenticatedAppLoadable = React.lazy(
  () => import('./UnauthenticatedApp')
);

// Fetch user auth state here and return user if logged in
// Render AuthenticatedApp or UnauthenticatedApp based on user
const Root: React.FC = () => {
  const { user } = useAuth();
  return user ? <AuthenticatedAppLoadable /> : <UnauthenticatedAppLoadable />;
};
That’s it! If a user is not logged in, we ship them a small bundle that only contains code necessary to render parts of the application related to login and signup, as well as a few global components. Code related to billing, account-level and zone-level products, sidebar navigation, and user profile settings are all bundled into a separate sub-application that only gets loaded once a user logs in.
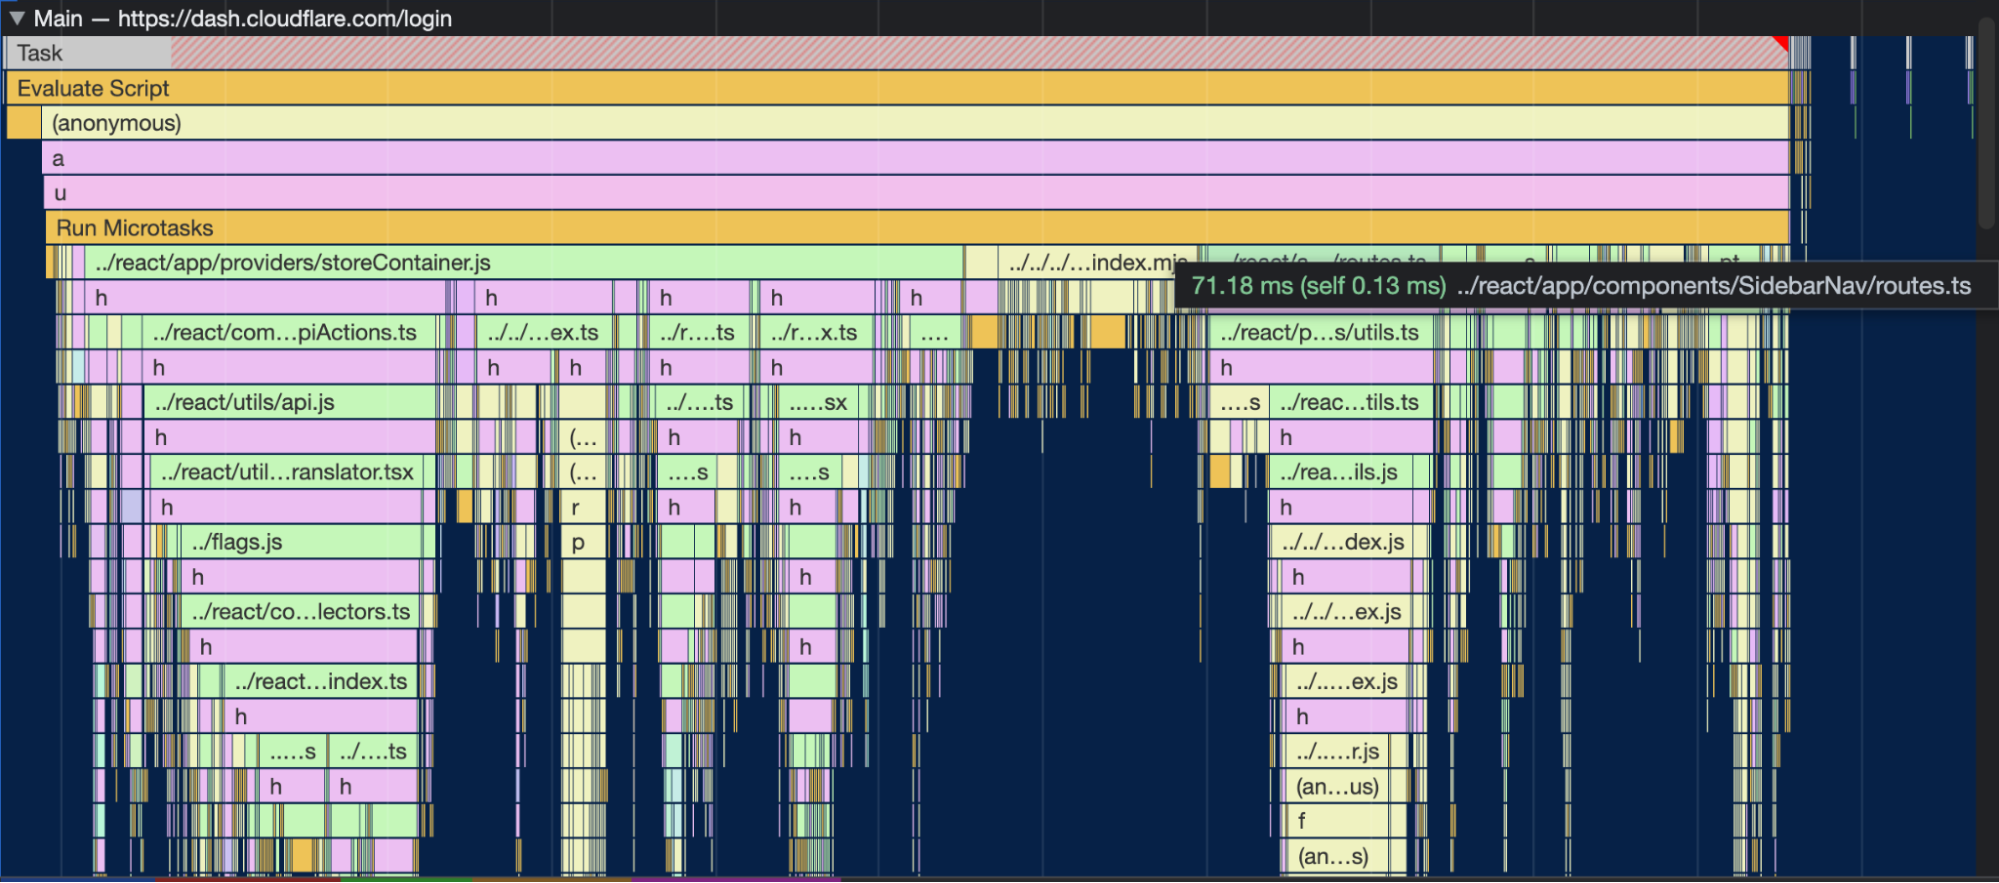
Again, we saw significant improvements, especially to Largest Contentful Paint, pushing our performance scores to about 80. However, we ran a Chrome performance profile, and on closer inspection of the longest blocking task we noticed that there was still unnecessary code being parsed and evaluated, even though we never used it. For example, code for sidebar navigation was still loaded for unauthenticated users who never actually saw that component.

Optimized dead-code elimination
It turned out that our configuration for dead-code elimination was not optimized. Dead-code elimination, or “tree-shaking”, is the process in which your JavaScript transpiler automatically removes unused module imports from the final bundle. Although most modern transpilers have that setting on by default today, optimizing dead-code elimination for an existing application as old as the Cloudflare dashboard is not as straightforward.
We had to go through each individual JavaScript import to identify modules that didn’t produce side-effects so they could be marked by the transpiler to be removed. We were able to optimize “tree-shaking” for the majority of the modules, but this will be an ongoing process as we make more performance improvements.
Key results
Although the performance of the dashboard is not yet where we want it to be, we were still able to roll out significant improvements for the majority of our users. The table below shows the performance benchmarks for US users hitting the login page for the first time before and after the performance improvements.
Desktop

Mobile

What’s next
Overall, we were able to get some quick wins, but we’re still not done! This is just the first step in our mission to continually improve performance for all of our dashboard users. Here’s a look at some next steps that we will be experimenting with and testing in the coming months: decoupling signup pages from the main application, redesigning SSO login experience, exploring microfrontends and edge-side rendering.
In the meantime, check out Cloudflare Speed Test to generate a performance report and receive recommendations on how to improve the performance of your site today.
We protect entire corporate networks, help customers build Internet-scale applications efficiently, accelerate any website or Internet application, ward off DDoS attacks, keep hackers at bay, and can help you on your journey to Zero Trust.
Visit 1.1.1.1 from any device to get started with our free app that makes your Internet faster and safer.
To learn more about our mission to help build a better Internet, start here. If you're looking for a new career direction, check out our open positions.
