Symbolic Execution can get a bad rap. Generic symbex tools have a hard time proving their worth when confronted with a sufficiently complex target. However, I have found symbolic execution can be very helpful in certain targeted situations. One of those situations is when triaging a large number of crashes coming out of a fuzzer, especially in cases where dealing with a complicated or opaque target. This is the "Good Situation" I have found myself in before, where my fuzzer handed me a large load of crashes that resisted normal minimization and de-duplication. By building a small symbolic debugger I managed a much faster turnaround time from fuzz-case to full understanding.
In this post I want to share my process for writing symbolic execution tooling for triaging crashes, and try to highlight tricks I use to make the tooling effective and flexible. The examples here all use the great Triton library for our symbolic execution and solving. The examples all use code hosted at: github.com/atredis-jordan/SymbolicTriagePost
(Oh BTW, we have a course!) Do you reverse engineer and symbolically execute in your workflows, or want to?
Are you using fuzzing today but want to find more opportunities to improve it and find deeper and more interesting bugs?
Can you jam with the console cowboys in cyberspace?
We've developed a 4-day course called "Practical Symbolic Execution for VR and RE" that's tailored towards these exact goals. It’s fun and practical, with lots of demos and labs to practice applying these concepts in creative ways. If that sounds interesting to you, there is more information at the bottom of this post. Hope to see you there!
We will be using a bunch of crashes in Procmon64.exe for our examples. Procmon's parsing of PML (Process Monitor Log) files is pretty easy to knock over, and we can quickly get lots of crashes out of a short fuzzing session. It is a large opaque binary with some non-determinism to the crashes, so useful tooling here will help us to speed up our reverse engineering efforts. Note that we weren't exhaustive in trying to find bugs in Procmon; so although these bugs we will talk about here don't appear super useful to an attacker, I won't be opening any untrusted PML files any time soon.
I gathered a bunch of crashes by making a few very small PML files and throwing Jackalope at the target. After a few hours we had 200ish odd crashes to play with. Many of the crashes were unstable, and only reproduced occasionally.
..\Jackalope\Release\fuzzer.exe -iterations_per_round 30 -minimize_samples false -crash_retry 0 -nthreads 32 -in - -resume -out .\out -t 5000 -file_extension PML -instrument_module procmon64.exe -- procmon64.exe /OpenLog @@ /Quiet /Runtime 1 /NoFilter /NoConnect
Fuzzing Procmon's PML paser with Jackalope
A Simple Debugger
With all this hyping up symbolic execution, our first step is to not use Symbolic Execution! Knowing when to turn to symbolic execution and when just to use emulation or a debugger is a good skill to have. In this case, we are going to write a very simple debugger using the Windows debugging API. This debugger can be used to re-run our crashing inputs, find out how stable they are, see if they all happen in the main thread, gather stack traces, etc.
Also, having a programmatic debugger will be very useful when we start symbolically executing. We will talk about that here in a second, first let's get our debugger off the ground.
Quick aside. All my code examples here are in python, because I like being able to pop into IPython in my debuggers. I defined a bunch of ctypes structures in the win_types.py file. I recommend having some programmatic way to to generate the types you need. Look into PDBRipper or cvdump as a good place to start.
Okay, so first we want a debugger that can run the process until it crashes and collect the exception information. The basic premise is we start a process as debugged (our connect_debugger function in triage.py), and then wait on it until we get an unhandled exception. Like so:
    handle, main_tid = connect_debugger(cmd)

    log("process", 3, f": -- ")

    event = dbg_wait(handle, None)
    code = event.dwDebugEventCode

    if code == EXIT_PROCESS_DEBUG_EVENT:
        log("crash", 1, f" Closed with no crash")
    elif code == EXCEPTION_DEBUG_EVENT:
        # exception to investigate
        log("crash", 1, f" crashed:")
        er = event.u.Exception.ExceptionRecord
        log("crash", 1, exceptionstr(handle, er, event.dwThreadId))

    else:
        log("process", 1, f" hit unexpected Debug Event ")

    dbg_kill(handle)
A piece of triage.py's handle_case, running a single test case

Running the above code to get the exception information from a crash
Many of the crashes will not happen every time due to some non-determinism. Running through all our test cases multiple times in our debugger, we can build a picture of which crashes are the most stable, if they stay in the main thread, and what kind of exception is happening.
.\crsh\access_violation_0000xxxxxxxxx008_00000xxxxxxxx5AA_1.PML -- 100% (18) -- main thread
         EXCEPTION_ACCESS_VIOLATION(0xc0000005) @ 0x520 read at 0x5aa
         EXCEPTION_STACK_BUFFER_OVERRUN(0xc0000409) @ 0x83c
.\crsh\access_violation_0000xxxxxxxxx008_00000xxxxxxxx5AA_2.PML -- 100% (34) -- main thread
         EXCEPTION_ACCESS_VIOLATION(0xc0000005) @ 0x520 read at 0x5aa
.\crsh\access_violation_0000xxxxxxxxx063_00000xxxxxxxx3ED_1.PML -- 100% (34) -- main thread
         EXCEPTION_ACCESS_VIOLATION(0xc0000005) @ 0x520 read at 0x3ed
...
.\crsh\access_violation_0000xxxxxxxxx3D4_00000xxxxxxxxED1_2.PML -- 52% (23) -- main thread
         EXCEPTION_ACCESS_VIOLATION(0xc0000005) @ 0x87a read at 0xed1
.\crsh\access_violation_0000xxxxxxxxx234_00000xxxxxxxxED4_3.PML -- 45% (22) -- main thread
         EXCEPTION_ACCESS_VIOLATION(0xc0000005) @ 0x649 read at 0xa2
         EXCEPTION_ACCESS_VIOLATION(0xc0000005) @ 0x87a read at 0xed4
.\crsh\access_violation_0000xxxxxxxxx3CA_00000xxxxxxxxED1_1.PML -- 45% (22) -- main thread
         EXCEPTION_ACCESS_VIOLATION(0xc0000005) @ 0x87a read at 0xed1
.\crsh\access_violation_0000xxxxxxxxx5EC_00000xxxxxxxx0A2_1.PML -- 45% (22) -- main thread
         EXCEPTION_ACCESS_VIOLATION(0xc0000005) @ 0x87a read at 0xed4
.\crsh\access_violation_0000xxxxxxxxx5EF_00000xxxxxxxxF27_1.PML -- 45% (22) -- main thread
         EXCEPTION_ACCESS_VIOLATION(0xc0000005) @ 0x649 read at 0xa2
         EXCEPTION_ACCESS_VIOLATION(0xc0000005) @ 0x87a read at 0xecb
.\crsh\access_violation_0000xxxxxxxxxB46_00000xxxxxxxxFF4_1.PML -- 44% (18) -- main thread
         EXCEPTION_ACCESS_VIOLATION(0xc0000005) @ 0x87a read at 0xed4
         EXCEPTION_ACCESS_VIOLATION(0xc0000005) @ 0x649 read at 0xa2
.\crsh\access_violation_0000xxxxxxxxx25A_00000xxxxxxxxED4_1.PML -- 38% (21) -- main thread
         EXCEPTION_ACCESS_VIOLATION(0xc0000005) @ 0x649 read at 0xa2
         EXCEPTION_ACCESS_VIOLATION(0xc0000005) @ 0x87a read at 0xecb
         EXCEPTION_ACCESS_VIOLATION(0xc0000005) @ 0x19d read at 0x184
...
Gathered information from multiple runs
Let me have another quick aside. Windows exceptions are nice because they can contain extra information. The exception record tells us if an access violation is a read or a write, as well as the pointer that lead to the fault. On Linux, it can be hard to get that information programmatically, as a SEGFAULT is just a SEGFAULT. Here we can use our symbolic execution engine to lift only the faulting instruction. The engine will provide us the missing information on what loads or stores happened, letting us differentiate between a boring NULL read and an exciting write past the end of a page.
Getting our Symbolic Execution Running, and a Few Tricks
We now have a simple debugger working using the Windows debugger API (or ptrace or whatever). Now we can add our symbolic engine into the mix. The game plan is to use our debugger to run the target until our input is in memory somewhere. Then we will mark the input as symbolic and trace through the rest of the instructions in our symbolic engine.
Marking input as “symbolic” here means we are telling our engine that these values are to be tracked as variables, instead of just numbers. This will let the expressions we see all be in terms of our input variables, like “rax: (add INPUT_12 0x12)” instead of just “rax: 0x53”. A better term would be “concolic” (concrete-symbolic) because we are still using the actual value of these input bytes, just adding the symbolic information on top of them. I just use the term symbolic in this post, though.
Our debugger will tell us when we reach the exception. From there we should be able to inspect the state at the crash in terms of our symbolic input. For an access violation we hope to see that the pointer dereferenced is symbolically "(0xwhatever + INPUT_3c)" or some other symbolic expression, showing us what in our input caused the crash.
This information is useful for root causing the crash (we will see a couple cool tricks for working with this information in the next section). We gather this symbolic info so we can take the constraints that kept us on the crashing path, along with our own constraints, and send those to a solver. Using the solver we can ask "What input would make this pointer be X instead?" This lets us quickly identify a Write-What-Where from a Read8-AroundHere, or a Write-That-ThereGiveOrTake100. We can break our symbolic debugger at any point in a trace and use the solver to answer our questions.

Stopping at a breakpoint, and seeing what input would make RBX equal 0x12340000 here
Note: I should point out that it isn't strictly necessary to use a debugger at all. We could just load procmon64.exe and it's libraries into our symbolic execution engine, and then emulate the instructions without a debugger's help. If you see the great examples in the Triton repo, you will notice that none of them step along with a debugger. I like using a symbolic execution engine alongside a debugger for a couple of reasons. I’ll highlight a few of those reasons in the following paragraphs.
The main reason is probably to avoid gaslighting myself. With a debugger or a concrete execution trace I have a ground truth I can follow along with. Without that it is easy to make a mistake when setting up our execution environment and not realize until much later. Things like improperly loading libraries, handling relocations, or setting up the TEB and PEB on windows. By using a debugger, we can just setup our execution environment by pulling in chunks of memory from the actual process. We can also load the memory on demand, so we can save time on very large processes. In our example we load the memory lazily with Triton's GET/SET_CONCRETE_MEMORY_VALUE callbacks.
def tri_init(handle, onlyonsym=False, memarray=False):
    # do the base initialization of a TritonContext

    ctx = TritonContext(ARCH.X86_64)
    ctx.setMode(MODE.ONLY_ON_SYMBOLIZED, onlyonsym)
    if memarray:
        ctx.setMode(MODE.MEMORY_ARRAY, True)
    else:
        ctx.setMode(MODE.ALIGNED_MEMORY, True)
    ctx.setMode(MODE.AST_OPTIMIZATIONS, True)

    # set lazy memory loading
    def getmemcb(ctx, ma):
        addr = ma.getAddress()
        sz = ma.getSize()
        # will only load pages that have not been previously loaded
        tri_load_dbg_mem(ctx, handle, addr, sz, False)

    def setmemcb(ctx, ma, val):
        addr = ma.getAddress()
        sz = ma.getSize()
        # will only load pages that have not been previously loaded
        tri_load_dbg_mem(ctx, handle, addr, sz, True)

    ctx.addCallback(CALLBACK.GET_CONCRETE_MEMORY_VALUE, getmemcb)
    ctx.addCallback(CALLBACK.SET_CONCRETE_MEMORY_VALUE, setmemcb)

    return ctx
Setting up Triton in triage.py
The debugger also lets us handle instructions that are unknown to our symbolic execution engine. For example, Triton does not have a definition for the 'rdrand' instruction. By single stepping alongside our debugger, we can simply fix up any changed registers when we encounter unknown instructions. This could lead to a loss of symbolic information if the instruction is doing something with our symbolic inputs, but for the most part we can get away with just ignoring these instructions.
Lastly, using our debugger gives us another really nice benefit; we can just skip over whole swaths of irrelevant code! We have to be very careful with what we mark as irrelevant, because getting it wrong can mean we lose a bunch of symbolic information. With procmon, I marked most of the drawing code as irrelevant. When hitting one of these imports from user32 or gdi32, we place a breakpoint and let the debugger step over those calls, then resume single stepping with Triton. This saves a ton of time, as symbolic execution is orders of magnitude slower than actual execution. Any irrelevant code we can step over can make a huge difference.
Without a debugger we can still do this, but it usually involves writing hooks that will handle any important return values or side effects from those calls, instead of just bypassing them with our debugger. Building profiling into our tooling can help us identify those areas of concern, and adjust our tooling to gain back some of that speed.
    # skip drawing code
    if skip_imports:
        impfuncs = dbg_get_imports_from(handle, base, ["user32.dll", "gdi32.dll", "comdlg32.dll", "comctl32.dll"])
        for name in impfuncs:
            addr = impfuncs[name]

            # don't skip a few user32 ones
            skip = True
            for ds in ["PostMessage", "DefWindowProc", "PostQuitMessage", "GetMessagePos", "PeekMessage", "DispatchMessage", "GetMessage", "TranslateMessage", "SendMessage", "CallWindowProc", "CallNextHook"]:
                if ds.lower() in name.lower():
                    skip = False
                    break

            if skip:
                hooks[addr] = (skipfunc_hook, name)
Skipping unneeded imports in triage.py
For our target, skipping imports wasn't enough. We were still spending lots of time in loops inside the procmon binary. A quick look confirmed that these were a statically included memset and memcpy. We can't just skip over memcpy because we will lose the symbolic information being copied. So for these two, we wrote a hook that would handle the operation symbolically in our python, without having to emulate each instruction. We made sure that copied bytes got a copy of the symbolic expression in the source data.
    for i in range(size):
        sa = MemoryAccess(src + i, 1)
        da = MemoryAccess(dst + i, 1)
        cell = ctx.getMemoryAst(sa)
        expr = ctx.newSymbolicExpression(cell, "memcpy byte")
        ctx.assignSymbolicExpressionToMemory(expr, da)
Transfering symbolic information in our memcpy hook
These kind of hooks not only save us time, but they are a great opportunity to check the symbolic arguments going into the memcpy or memset. Even if the current trace is not going to crash inside of the memcpy, we have the ability to look at those symbolic arguments and ask "Could this memcpy reach unmapped memory?" or "Could the size argument be unreasonably large?". This can help us find other vulnerabilities, or other expressions of the issues we are already tracing. Below is a small check that tries to see if the end of a memcpy's destination could be some large amount away.
        astctx = ctx.getAstContext()
        cond = ctx.getPathPredicate()
        # dst + size
        dstendast = ctx.getRegisterAst(ctx.registers.rcx) + ctx.getRegisterAst(ctx.registers.r8)
        # concrete value of the dst + size
        dstendcon = dst + size
        testpast = 0x414141
        cond = astctx.land([cond, (dstendcon + testpast) <= dstendast])

        log("hook", 5, "Trying to solve for a big memcpy")
        model, status, _ = ctx.getModel(cond, True)
        if status == SOLVER_STATE.SAT:
            # can go that far
            # this may not be the cause of our crash though, so let's just report it, not raise it
            log("crash", 2, "Symbolic memcpy could go really far!")
A simple check in our memcpy hook from triage.py
The tradeoff of these checks is that invoking the solver often can add to our runtime, and you probably don't want them enabled all the time.
At this point we have most of what we need to run through our crashing cases and start de-duplicating and root-causing. However, some of our access violations were still saying that the bad dereference did not depend on our input. This didn't make sense to me, so I suspected we were losing symbolic information along the way somehow. Sometimes this can happen due to concretization of pointers, so turning on Triton's new MEMORY_ARRAY mode can help us recover that information (at the cost of a lot of speed).
In this case, however, I had my tooling print out all the imported functions being called along the trace. I wanted to see if any of the system calls on the path were causing a loss of symbolic information. Or if there was a call that re-introduced the input without it being symbolized. I found that there was another second call to MapViewOfFile that was remapping our input file into memory in a different location. With a hook added to symbolize the remapped input, all our crashes were now reporting their symbolic relation to the input correctly!

Our tooling showing an AST for one of the bad dereferences
Using our Symbolic Debugger
Cool! Now we have symbolic information for our crashes. What do we do with it?
Well first, we can quickly group our crashes by what input they depend on. This is quite helpful; even though some issues can lead to crashes in multiple locations, we can still group them together by what exact input is lacking bounds checks. This can help us understand a bug better, and also see different ways the bug can interact with the system.
By grouping our crashes, it looked like our 200ish crashes boil down to four distinct groups: three controlled pointers being read from and one call to __fastfail.
One neat tool Triton gives us is backward slicing! Because Triton can keep a reference of the associated instruction when building it's symbolic expressions, we can generate a instruction trace that only contains the instructions relevant to our final expression. I used this to cut out most code along the trace as irrelevant, and be able to walk just the pieces of code between the input and the crash that were relevant. Below we gather relevant instructions that created the bad pointer that was dereferenced in one of our crashes.
def backslice_expr(ctx, symbexp, print_expr=True):
    # sort by refId to put things temporal
    # to get a symbolic expression from a load access, do something like:
    # symbexp = inst.getLoadAccess()[0][0].getLeaAst().getSymbolicExpression()
    items = sorted(ctx.sliceExpressions(symbexp).items(), key=lambda x: x[0])
    for _, expr in items:
        if print_expr:
            print(expr)
        da = expr.getDisassembly()
        if len(da) > 0:
            print("\t" if print_expr else "", da)
A back-slicing helper in triage.py-

Back-slicing with the above code
Being able to drop into the IPython REPL at any point of the trace and see the program state in terms of my input is very helpful during my RE process.
For the call to __fastfail (kinda like an abort for Windows), we don't have a bad dereference to back-slice here, instead we have the path constraints our engine gathered. These constraints are grabbed any time the engine sees that we could symbolically go either way at a junction. To stay tied to our concrete path, the engine notes down the condition required for our path. For example: if we take a jne branch after having compared the INPUT_5 byte against 0, the engine will add a path constraint saying "If you want to stay on the path we took, make sure INPUT_5 is not 0", or "(not (= INPUT_5 (_ bv0 8))" in AST-speak.
These path constraints are super useful. We can use them to generate other inputs that would go down unexplored paths. There are lots of nice symbolic execution tools that use this to help a fuzzer by generating interesting new inputs. (SymCC, KLEE, Driller, to name three)
In our case, we can inspect them to find out why we ended up at the __fastfail. By just looking at the most recent path constraint, we can see where our path forked off most recently due to our input.

The most recent path constraint leading to the __fastfail

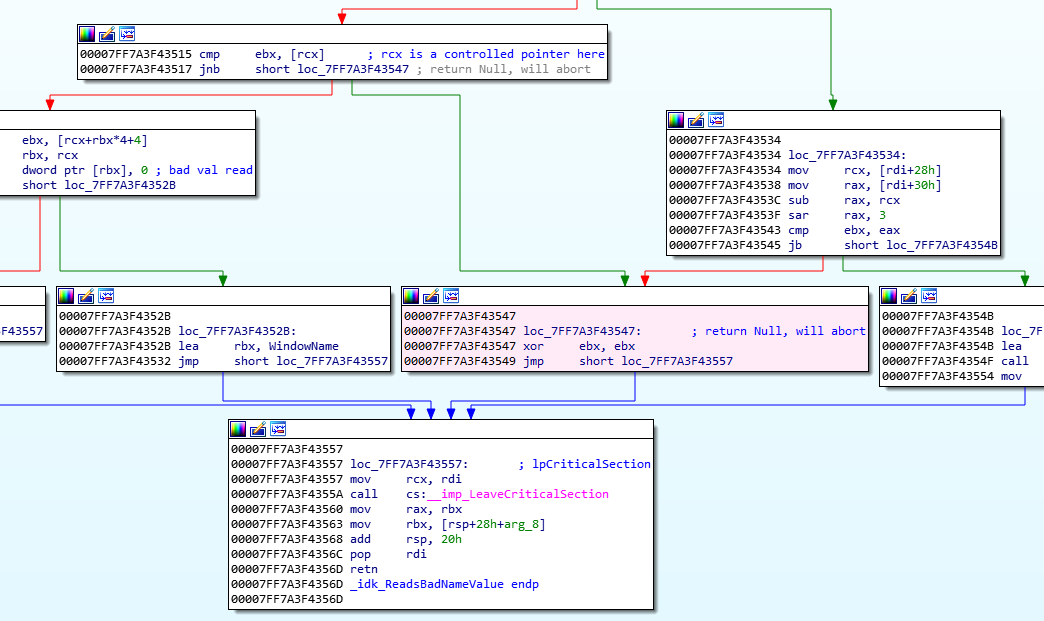
The disassembly around the most recent path constraint
The path constraint tells us that the conditional jump at 0x7FF7A3F43517 in the above disassembly is where our path last forked due to one of our input values. When we follow the trace after this fork, we can see that it always leads directly to our fatal condition. To get more information on why the compare before the fork failed, I dropped into an IPython shell for us at that junction. Our tooling makes it easy to determine the control we have over the pointer in RCX being dereferenced before the branch. That makes this another crash due to a controlled pointer read.

Showing the AST for the dereferenced register before the branch
Where To Go From Here
So from here we have a pretty good understanding of why these issues exist in procmon64.exe. Digging in a little deeper into the crashes shows that they are probably not useful for crafting a malicious PML file. If I wanted to keep going down this road, my next steps would include:
Generating interesting test cases for our fuzzer based off the known unchecked areas in the input
Identifying juicy looking functions in our exploit path. With our tooling we can gather information on what control we have in those functions. With this information we can start to path explore or generate fuzz cases that follow our intuition about what areas look interesting.
Patch out the uninteresting crash locations, and let our fuzzer find better paths without being stopped by the low-hanging fruit.
The official policy of Microsoft is "All Sysinternals tools are offered 'as is' with no official Microsoft support." We were unable to find a suitable place to report these issues. If anyone with ties to the Sysinternals Suite wants more information, please contact us.
Hope this Helped! Come Take the Course!
I hope this post helped you see useful ways in which creative symbolic execution tooling could help their workflow! If anyone has questions or wants to talk about it, you can message me @jordan9001 or at [email protected].
If you got all the way to the end of this post, you would probably like our course!
"Practical Symbolic Execution for VR and RE" is hands-on. I had a lot of fun making it, and we look at a variety of ways to apply these concepts. Students spend time becoming comfortable with a few frameworks, deobfuscating binaries, detecting time-of-check time-of-use bugs, and other interesting stuff.
You can give us your information below, and we will email you when we next offer a public course. (No spam or anything else, I promise.)
If you have a group that would be interested in receiving this kind of training privately, feel free to contact us about that as well! I’d like to see you in a class sometime!
Thanks!