BackgroundBy moving from our old codebase to Chromium, the Microsoft Edge team significantly 2022-1-21 04:22:8 Author: textslashplain.com(查看原文) 阅读量:41 收藏
Background
By moving from our old codebase to Chromium, the Microsoft Edge team significantly modernized our codebase and improved our compatibility with websites. As we now share the vast majority of our web platform code with the market-leading browser, it’s rare to find websites that behave differently in Edge when compared to Chrome, Brave, Opera, Vivaldi, etc. Any time we find a behavioral delta, we are keen to dive in and understand why Edge behaves differently. Sometimes, our investigation will reveal a behavior gap caused by a known and deliberate difference (e.g. we add an Edg/ token to our User-Agent string), but in the most interesting cases, something unexpected is found.
Yesterday, I came across an interesting case. In this post, I’ll share both how I approached root causing the difference, and explore how it can be avoided.
The Customer’s Issue
The Microsoft Edge team works hard to ensure that Enterprises can move fearlessly to Edge, both from legacy IE/Spartan, and from other browsers.
One such Enterprise recently contacted us to report that one of their workflows did not work as expected in Edge 96, noting that the flow in question works fine in both Google Chrome and Apple Safari.
Common causes (e.g. a different User-Agent header, Tracking Prevention set to defaults) were quickly ruled out as root causes: you can easily run Edge with a different User-Agent header (via the --user-agent command line argument or via the Emulation feature in the F12 Developer Tools) and Tracking Prevention reports any blocked storage or network requests to the F12 Console.
The customer’s engineers noted that the problem seemed to be that Edge was failing to send a cross-origin fetch request– NetLogs of the flow revealed that the fetch request began, but never completed. As a result of failing to send the request, a WebAPI was not invoked, and the user was unable to change the state of the web application.
This was a super-interesting finding because Edge shares essentially all of its code in this area with upstream Chromium.
The customer shared their NetLogs with us, and I took a shot at analyzing the traffic captured within. Unfortunately, the results were inconclusive: it was easy to see that the request had indeed not been sent, but it was not clear why.
Here’s a snippet of the log for the attempt to call the API. We see that the request was a POST to an invokeAPI page on a different server, and because of the request’s Content-Type (application/json) the browser was required to perform a CORS preflight request before sending the POST to the remote server.
145: URL_REQUEST https://logic.azure.com/invokeAPI
t=9118 [st=0] +CORS_REQUEST  [dt=175]
  --> cors_preflight_policy = "consider_preflight"
  --> headers = "...content-type: application/json\r\n..."
  --> is_external_request = false
  --> is_revalidating = false
  --> method = "POST"
  --> url = https://logic.azure.com/invokeAPI
t=9118 [st=0]  CHECK_CORS_PREFLIGHT_REQUIRED
             --> preflight_required = true
             --> preflight_required_reason ="disallowed_header"
t=9118 [st=0]    CHECK_CORS_PREFLIGHT_CACHE
             --> status = "miss"
t=9118 [st=0]    CORS_PREFLIGHT_URL_REQUEST
             --> source_dependency = 146 (URL_REQUEST)
t=9293 [st=175] -CORS_REQUEST
t=9411 [st=293]  CORS_PREFLIGHT_RESULT
   --> access-control-allow-headers = "content-type"
   --> access-control-allow-methods = "GET,HEAD,OPTIONS,POST"
Crucially, we see that at 9293 milliseconds (175ms after the request process began), the request was aborted (-CORS_REQUEST). Not until 118 milliseconds later did the response to the preflight (CORS_PREFLIGHT_RESULT) come back saying, in effect, “Sure, I’m okay with accepting a request with that Content-Type and the POST method.” But it was too late– the request was already cancelled. The question is: “Why did the request get cancelled?”
A quick look at the webapp’s JavaScript didn’t show any explicit code that would cancel the fetch(). My hunch was that the request got cancelled because the fetch() call was in a frame that got navigated elsewhere before the request completed, but in this complicated application, network requests were constantly firing. That made it very difficult to prove or disprove my theory from looking at the Network Traffic alone. I tried looking at an edge://tracing log supplied by the customer, but the application was so complicated that I couldn’t make any sense of it.
And the larger question loomed: Even if teardown due to navigation is the culprit, why doesn’t this repro in Chrome?
The overall workflow involves several servers, including a SharePoint site, Microsoft Outlook Online, and custom logic running on Microsoft Azure. There didn’t seem to be any good way for us to emulate this workflow, but fortunately, the customer was willing to provide us with credentials to their test environment.
I started by confirming the repro in both Edge Stable and Canary, and confirming that the problem did not repro in either Chrome Stable or Canary. As this web application used a ServiceWorker, I also confirmed that unregistering the worker (using the Application tab of the F12 DevTools) did not impact the repro.
With this confirmation in hand, I then aimed to test my hunch that navigation was the root cause of the WebAPI fetch request not being sent.
A New Debugging Tool
One significant limitation of NetLogs is that, while the URL_REQUEST entries in the log have tons of information about the content and network behavior of the request, the NetLogs don’t have much context about why a given request was made, or where its result will be used by the web application.
Fortunately, Chromium’s rich extensibility model surfaces events for both Navigations and Network Requests, including (crucially) information about which browser tab and frame generated the event.
As a part of my recent NativeMessaging Debugger project, I built a simple sample extension which watches for navigations and sends information out to a log window. For this exercise, I updated it to also watch for WebRequests. With this new logging in place, I reproduced the scenario, and it was plain that the fetch() call to the WebAPI was being cancelled due to navigation:
14:26:40:7164 - {"event":"navigation","destination":https://customer/MyTasks.aspx,"tabId":60,"frameId":0,"parentFrameId":-1,"timeStamp":1642624000710.5059}

14:26:40:7194 - {"event":"webRequest","method":"POST","url":https://logic.azure.com/invokeAPI,"tabId":60,"frameId":0,"parentFrameId":-1,"timeStamp":1642624000716.684,"type":"xmlhttprequest"}

14:26:40:7254 - {"event":"webRequest","method":"GET","url":https://customer/MyTasks.aspx,"tabId":60,"frameId":0,"parentFrameId":-1,"timeStamp":1642624000722.692,"type":"main_frame"}
The first event shows a top-level navigation (tabId:60, frameId:0) begin to MyTasks.aspx, although the navigation’s request hasn’t hit the network yet.
Then, six milliseconds later, we see the WebAPI’s fetch() call begin.
Six milliseconds after that, we see the network request for the navigation get underway, effectively racing against the outstanding WebAPI call.
From our NetLog, we know the navigation wins– the WebAPI’s fetch() preflight alone took 293ms to return, and the overall fetch request was aborted after just 175ms, right after the navigation’s request got back a set of HTTP/200 response headers.
So, my hunch is confirmed: The API call was aborted because the script context in which it was requested got torn down.
I was feeling pretty smug about my psychic debugging success but for one niggling thought: Why was this only happening in Edge?
Maybe this is happening because Chrome has some experiment running that changes the behavior of CORS or the JavaScript scheduler? I checked chrome://version/?show-variations-cmd and searched for any likely experiment names. Nothing seemed very promising, although I tried using the --enable-features command line argument to turn on a few flags in Edge to see if they mattered. No dice — Edge still repro’d the issue. I tried performing the repro in my local version of Chromium, which doesn’t run with any server-controlled flags. No dice — Chromium didn’t repro the issue. I even tried running a bisect against Chromium to see if any older Chromium build has this problem. Nope, going all the way back to Chrome 60, the workflow ran just fine.
I wanted to try bisecting against Edge, but unfortunately this isn’t simple to do without being set up with an Edge development environment (I develop directly against upstream Chromium). However, I did have a standalone copy of Edge 91 handy, and the problem repro’d there as well, so at least this wasn’t a super-recent regression.
I don’t like unsolved mysteries, but by this point I at least knew how the customer could fix this on their side. Their code for submitting the form looked like this:
  t.prototype.Submit = function() {
   this.callAPI(this.email, t),
   alert("Success"),
   setTimeout(function() {console.log("Wait 1sec")},1000),
   location.href = n + "/MyTasks.aspx")
 };

 t.prototype.callAPI = function(e, t) {
  var n = JSON.stringify({data: e}), o = new Headers;
  o.append("Content-type", "application/json");
  var i = {body: n,headers: o};
  this.post("https://logic.azure.com/invokeAPI",i).then(function(e)
         {return console.log("API call complete"), e.json()})
 };
As you can see, the Submit() function calls the callAPI() function to send the POST request, then shows an alert saying “Success”. Script execution pauses while the alert dialog is showing. When the user clicks “OK” in the alert(), a setTimeout call queues a callback with a one second delay, then navigates the top-level page to MyTasks.aspx.
This looks like a mistake– the location.href= call was probably meant to be inside the setTimeout callback; otherwise, that callback probably will never run because the page will have been torn down by the navigation before the callback’s console.log statement runs.
But more broadly, this code seems fundamentally wrong: We’re telling the user that the operation yielded “Success”, but we never actually waited for the WebAPI call to succeed— we just fired it off and then immediately showed the “Success” popup. The alert() and location.href='...' lines should probably be inside the then block on the .post call, and there should probably be error handling code for the case where that post call returned an error for any reason.
I wrote up this suggestion and sent it off to the customer– this should resolve their issue in Edge, and it’s more logical and correct in every browser.
…And yet… why is Edge different?
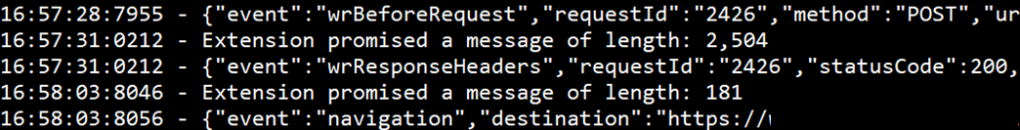
I went back to look at the event logs from my repro again. And I noticed something crucial: in Chrome, the wrBeforeRequest event signaling the start of the WebAPI call appeared before the alert dialog box, and the wrResponseHeaders event appeared while the alert box was up (3 seconds later). Only after I clicked OK on the dialog box (32 seconds after that) did the navigation event occur:

In contrast, in Edge, the alert dialog box appears before the wrBeforeRequest event– in fact, the wrBeforeRequest event isn’t even seen until after clicking OK to dismiss the dialog. At that point, the WebAPI and Navigation requests race, and the WebAPI request will almost always lose the race.
Ah ha! So we’re getting closer. Edge is failing because its fetch call is getting blocked until dismissal of the modal alert. That’s weird. Maybe it’s something about this site’s JavaScript? I tried creating a minimal repro where a fetch() would get kicked off asynchronously and then an alert() would immediately follow. In Chrome, the fetch ran as expected, while in Edge, the fetch blocked on the user clicking OK.
Now we’re cooking with gas. A working minimal repro dramatically increases the odds of solving any mystery, because it makes testing theories much simpler, and roping in other engineers much cheaper– instead of asking them to perform complicated repro steps that may take tens of minutes, you can say “Click this link. Push the button. See the bug. Weird, right?“
There’s been quite a lot of recent discussion about the Chrome team’s concerns about the 3 Web Platform modal dialog primitives (alert(), prompt(), and confirm()) and how they interact with the JavaScript event loop. Furious webdevs complain “If it ain’t broke, don’t fix it” and the web platform folks retort: “Oh, it’s very much broke, and we need to fix it!”.
Perhaps there’s some related change upstream is experimenting with? I spent another fruitless hour looking into their experimental configuration and ours, and bothering Edge’s alert() owners to find out if perhaps we might have changed anything about our alert() implementation for accessibility reasons or the like. No dice.
I wrote up my latest findings and sent them off to my engineers. With a reduced repro in hand, our Dev Manager popped up the edge://tracing tool and had a look around. He replied back: I suspect it has something to do with an Edge-specific throttle. Specifically, I see a WebURLLoader::Context::Start hitting a mojom.SafeBrowsingUrlChecker call that I don’t see in Chrome.
For context: Chromium supports the notion of throttles which allow a developer to react to events as the user browses around. For instance, throttles for resource loaders allow you to block and modify requests, which browser developers use to perform reputation scans for SafeBrowsing or SmartScreen, for example. NavigationThrottles allow developers to redirect or cancel navigations, and so on.
Microsoft Edge uses a throttle to implement our Tracking Prevention feature.
Way back in December 2019, one of our engineers noted that a test case behaved differently in Edge vs. Chrome. That test case was a page with three XHRs: two asynchronous and one synchronous. In Chrome, the two async calls ran in parallel with the sync call, while in Edge, the two async calls were blocked upon completion of the one sync call. The root cause was related to the Tracking Prevention throttle needing to perform a cross-process communication to check whether the XHRs’ url targets were potentially tracking servers. Even though synchronous XHRs are evil and need to die, we still fixed the testcase by updating the throttle so that it doesn’t run on same-origin requests (because they cannot be, by definition, 3rd party trackers).
In this week’s repro, the fetch call is async, but alert() is not– it’s a synchronous API that blocks JavaScript. And the WebAPI is to a 3rd-party URL, so the 2019 fix doesn’t prevent the throttle from running.
One interesting finding during the 2019 investigation was that turning off Tracking Prevention in edge://settings does not actually disable the throttle– it simply changes the throttle to not block any requests. With this recollection, I used the command line argument to disable the throttle entirely:
msedge.exe --disable-features=msEnhancedTrackingPreventionEnabled
…and confirmed that the minimal test page now behaves identically in Edge vs. Chrome.
We’ve filed a bug against the throttle to figure out how to address this case, but the recommendation to the customer stands: the current logic popping the alert() box ought to change such that either there’s no alert(), or it only shows success after the fetch() call actually succeeds.
-Eric
如有侵权请联系:admin#unsafe.sh