2021-11-27 07:53:0 Author: www.boredhackerblog.info(查看原文) 阅读量:16 收藏
Introduction
This post just discusses sending unifi logs to grafana loki and utilizing vector.dev/vector agent.
Typically for log collection I would utilize something like Beats (filebeat, winlogbeat) and Logstash. Logstash unfortunately, in my experience, uses too much memory and CPU resources so I decided to search for an alternative. I came across vector.dev, fluentd, and fluentbit. Vector.dev seemed to be easy to install, configure, and use so I decided to give that a try.
For log storage and search, I would normally use Elasticsearch & Kibana, Opensearch, Graylog, or Humio. Humio would be hosted in the cloud and anything that's Elasticsearch or Elasticsearch-based would also require too much memory and CPU resources. I found Grafana Loki and decided to try that. It seems relatively lightweight for my needs and runs locally. Also I saw a Techno Tim video on Loki recently.
Logs will be stored with Loki and I'll use Grafana to connect to Loki and use it to query and display the data.
Vector and Grafana Loki will be running on a NUC w/ Celeron CPU w/ 4GB RAM so having something that runs on Pi (grafana has an article where they run grafana loki on a pi) is nice.
Design
Unifi controller has an option to send logs to a remote system so that's what I'll be using to send logs. It will send syslog (udp) to an IP address.
Vector has sources, transforms, and sinks. Source is input/data source, transforms can apply various operations to the data, such as filtering or renaming fields, and sink is basically the output. I will be just using source and sink. Source in this case will be syslog. Vector will listen on a port for syslog messages. Sink will be Loki since that's where the logs will be stored.
I'll have one VM running vector and the same VM will be running Grafana UI and Loki using docker-compose.
Unifi Controller Syslog -> (syslog source) Vector (Loki sink) -> Loki <- Grafana WebUI
I am not using doing any encryption in transit or using authentication for loki, it is an option.
Setup
I have an Ubuntu 20.04 server w/ docker and docker-compose installed.
Grafana Loki
Grafana docker tutorial shows how to set up grafana loki with docker-compose: https://grafana.com/docs/loki/latest/installation/docker/
I removed promtail container from my configuration.
Here's the configuration I'm using:
https://gist.github.com/BoredHackerBlog/de8294818027d450ecc2aed9c94c5260
Create a new loki folder and grafana folder as docker will mount.
Download https://raw.githubusercontent.com/grafana/loki/v2.4.1/cmd/loki/loki-local-config.yaml and place it in loki folder and rename the file to local-config.yaml. Change the configuration if needed.
No need to download and place anything in the grafana folder.
Run docker-compose up -d to start grafana and loki.
Grafana webui is running on port 3000 and default creds are admin/admin.
Go to configuration and add loki as the data source. docker-compose file refers to that container as loki so it'll be at http://loki:3100.
Vector
Now Vector needs to be setup.
I'm setting it up by just following their quickstart guide.
I ran: curl --proto '=https' --tlsv1.2 -sSf https://sh.vector.dev | bash
Default config file is located at ~/.vector/config/vector.toml
Here's my config for syslog source and loki sink:
https://gist.github.com/BoredHackerBlog/de8294818027d450ecc2aed9c94c5260
I modified the syslog port to be 1514 so I can vector as a non-privileged user and I also changed mode to udp.
For loki sink, label is required but your label key value can be anything you prefer. I could have done labels.system = "unifi" and it would work just fine.
Once configuration is done, the following command can be ran to start vector: vector --config ~/.vector/config/vector.toml
Unifi controller
In unifi controller settings, remote logging option is under Settings -> System -> Application Configuration -> Remote Logging
Here's what my configuration looks like:
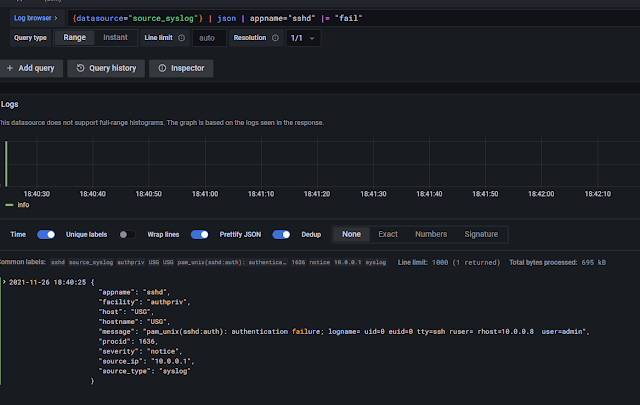
Click Apply to apply changes and the logs should flow to vector and into loki.
!!!
no logs in grafana query
I did have a weird issue where logs didnt show up in grafana query but would show up when i do live query.
I ran "sudo timedatectl set-timezone America/New_York" to update my timezone and that fixed the issue. (or it didn't but i think it did because queries did show results after i ran this)
!!!
如有侵权请联系:admin#unsafe.sh


